I had an HTML page with javascript and wanted to debug it and see what was going on. It was all pretty easy, but some things took a while to understand. I’ll describe some of the things I did using Chrome browser. Firefox has similar capabilities.
I found JavaScript debugging reference which looks pretty good.
Using the Chrome Debugger Tools, part 3: The Sources Tab is pretty comprehensive.
Getting started
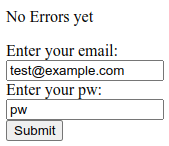
- Display an html page.
- To get into developer tools use Ctrl+Shift+I
You get a display like

- The web page (squashed up) to a narrow column
- Elements – you can see the HTML components. As you move your mouse over the elements in the list, the fields in the web page are highlighted
- Sources – you can see the source of the program with the javascript etc. Errors in the file will get flagged on this page
- “Debug” switch. The icon next to it is the “step over”
- “Watch” – You can specify which variables you want displayed permanently
- “Scope” you can list and display all the variables available to you at that point in the web page
- An example of the source
Display and edit the HTML
Clock on the Elements tab (2 in the above picture) to display the source.
You may have your javaScript within the page, or referenced by http://./reply.js. You can see these under the page sub tab, or as a tab in the source (7). You may have to click on the name on the “Page” tab, to get it displayed in the source pane.
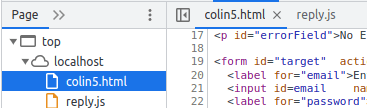
This shows sssserver.html is the main one, and checkCipher.js has been included. Some of these may be displayed as tabs above the sourc
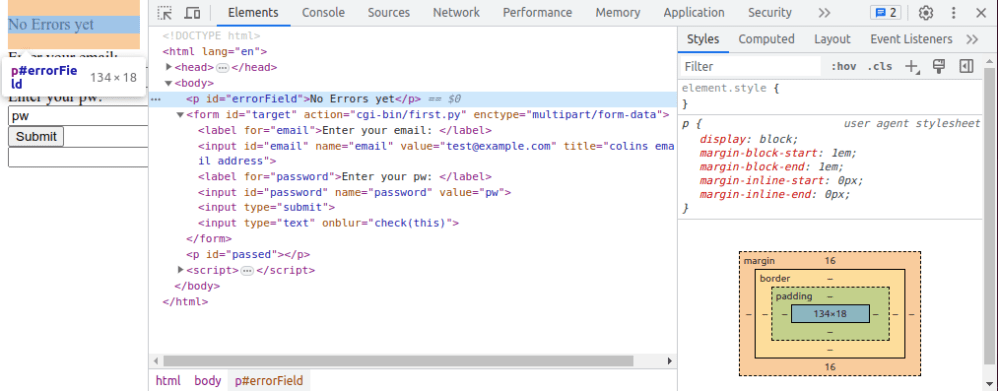
- It gives a good high level view of the program for example it may have <head>…</head>. The … show there is omitted content. Click on the … to display the content.
- As you move your mouse over the HTML the web page elements will be highlighted. Moving over the <body> shows the whole web page, moving over a <p> shows just the paragraph.
- As you click on some html, it displays the CSS on the right had side.
- It tells you what CSS is being used for example the “p” tag with option “display”:block
- As you move your mouse over the CSS picture it highlights the data on the html page
- You can edit the HTML, add elements, delete elements etc
Set breakpoint
- Click on the Sources (3) tab
- Click on the line number of interest – it toggles blue.
- Run the page
Step through the code
- Click on the Sources (3) tab.
- Click on the pause button (4); it gets grayed out
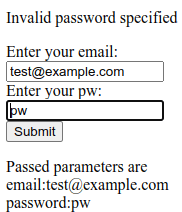
- Run your script. I clicked the submit button.
- The display changes and it shows “Debugger paused”.
- Open the “watch” twistie and click “+”. You can now enter a variable name to display the object.
- Open the object’s twistie to display the attributes of the object
- Open the “Scope” twistie. Open the “Local” twistie. This will display all of the local variables. Open the variable’s twistie to see all its attributes. I do not think you can change the data. Use ctrl+alt+left mouse to expand or compress the twistie.
- Open the “watch” twistie and click “+”. You can now enter a variable name to display the object.
- Open the “Breakpoint” twistie and select “Pause on uncaught exception” and “Pause on caught exception“. This will stop when it detects a problem
- If you click the icon next to the Pause Icon (or F10) it will step through the code.
- If you click on a line of javascript and use right-click you select “Continue to here”.
- Within an active code segment, hovering over a variable will display the attributes. (You can also go to “Scope” and display from that window. Clicking on the window object( for example) gives all the operations you can do on that object (for example all of the on…. method names) .
- If your code has console.log(“something”) this will appear in the console tab.
To get out of the current debug press the browser’s stop (X) and browser’s “reload/refresh” button.
Where did it spend its time?
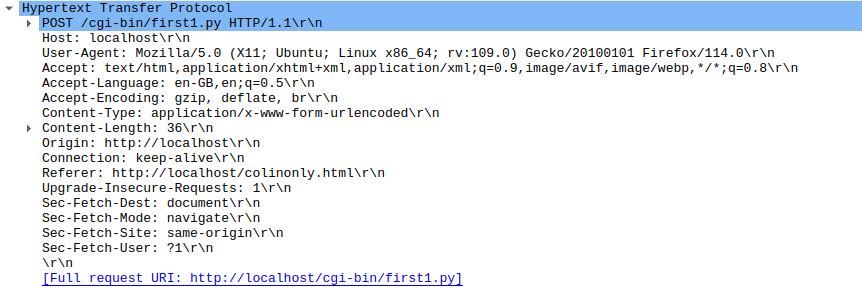
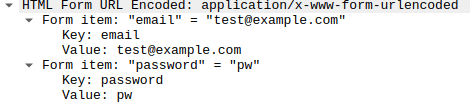
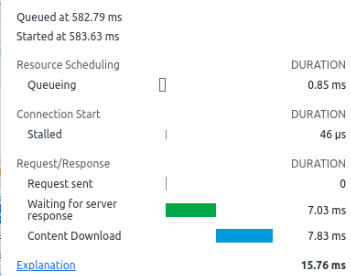
If you click on the “Network” tab it shows where time was spent on the network. For example which files were got, and how long it took to get the data. It gives information on
- Which file was loaded.
- Status – 200 is OK.
- Type eg .gif.
- Initiator – which page did the request come from.
- Size ( if it was downloaded) or “cache” if it was already in the browser cache.
- Time in milliseconds.
- “Waterfall” breaks down the time spent
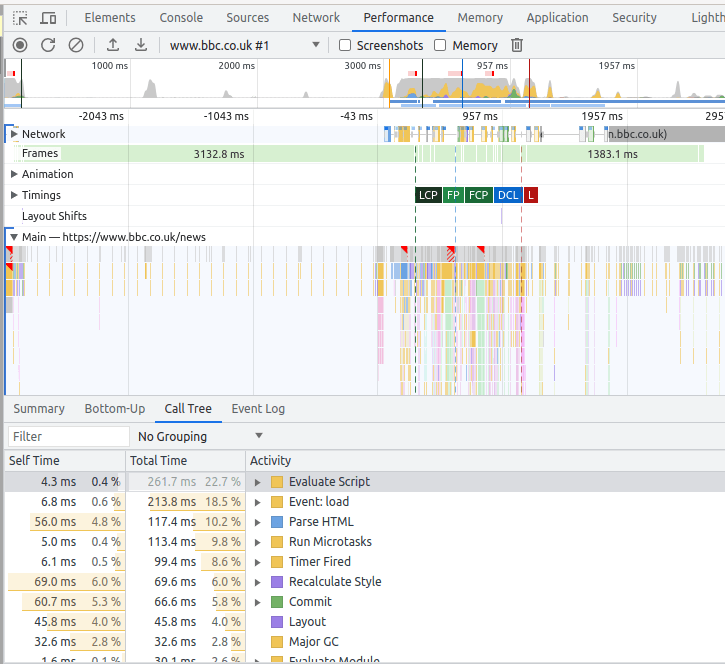
Under the “Performance” tab you can record the activity, and display it.
Use Control+E to start, then Ctrl+E to stop it.
It displays information like
What do all of the keys do?
If you click on the settings wheel, and select Shortcuts, it displays all the options and key combinations.
Debugging a java script file?
Chrome caches these. Disable this by going to the Network table and click on “disable cache”