You can use the IBM healthcenter to get information from what is running within Java.
I used Java startup option
-Xhealthcenter
-Dcom.ibm.diagnostics.healthcenter.headless=on
-Dcom.ibm.java.diagnostics.healthcenter.data.collection.level=headless
-Dcom.ibm.java.diagnostics.healthcenter.headless.files.max.size=50000000
-Dcom.ibm.java.diagnostics.healthcenter.headless.delay.start=1
-Dcom.ibm.java.diagnostics.healthcenter.headless.output.directory=/u/tmp/zowe
-Dcom.ibm.diagnostics.healthcenter.readonly=on
-Dcom.ibm.diagnostics.healthcenter.logging.level=fine
-Dcom.ibm.diagnostics.healthcenter.jmx=off
-Dcom.ibm.java.diagnostics.healthcenter.agent.transport=jrmp
-Xtrace:buffers={2m,dynamic}
which are described here.
I used -Dcom.ibm.java.diagnostics.healthcenter.headless.delay.start=1 to wait for a minute before recording, so I didn’t get the Java startup information.
When I started the Java program I got out messages
com.ibm.diagnostics.healthcenter.headless INFO: Headless data collection has started
com.ibm.diagnostics.healthcenter.headless INFO: Agent will keep last 5 hcd files
com.ibm.diagnostics.healthcenter.headless INFO: Headless collection output directory is /u/tmp/zowec
Shutdown the Java program.
I got a file healthcenter080225_160620_33620365_1.hcd in /u/tmp/zowec.
Download this in binary to your workstation.
Start Eclipse. Window-> Perspective-> Open Perspective-> Other-> Health center profiling
File-> Load Data… Select your downloaded file.
From the status window you can select different views of the data
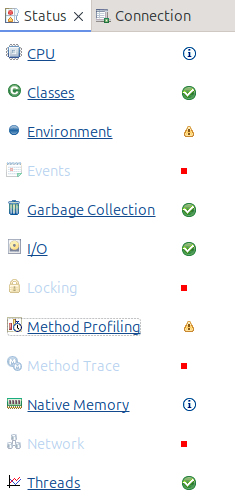
Method profiling
This display information like
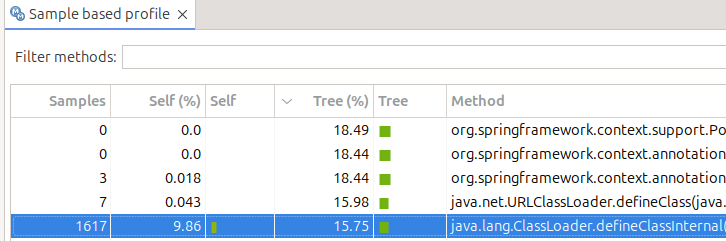
- Under Tree%this says 18.49 of the time was spent in this class…. including other classes it called
- Under Self% this is the amount of time spent within just this class. 9.86 of the total time was spent within this class. 15.75 of the total time was spent in just this class. It was recorded in 1617 sample
- If you select a line, in another part of the display it shows you what called it, and what it called.
CPU
Shows the amount of CPU used over time
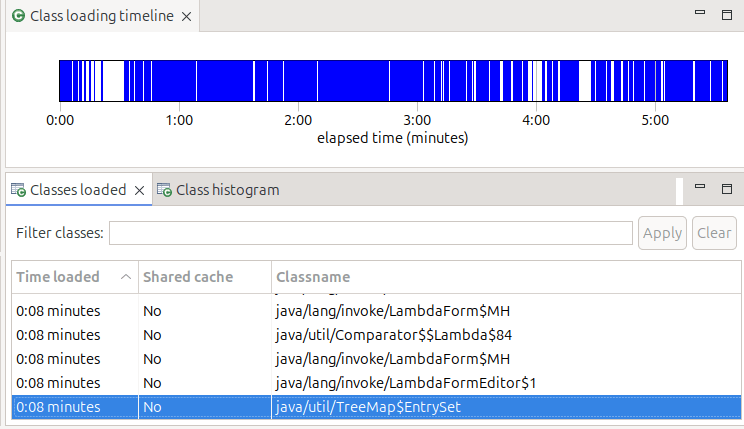
Classes
Shows time from start when classes were loaded, and if they were shared classes or not,
Environment
Give you the start option, and information about the JVM
Garbage collection
Gives you a profile and other information on garbage collection
IO
Gives you information about IO. My display said “Your application has opened 45 files and closed 39 files.” It did not tell me which files were opened – it just showed the 6 which were still open, so not very useful!
