Using a cuckoo function

I was trying to track down a problem in Java where shared memory was not being accessed as it should. This was too early in the JVM startup for trace – so how to debug it?

One option I tried was using a cuckoo function. The Java code uses the C run time function shmget() — Get a shared memory segment. I wanted to write a stub function to display parameters, and then call the system version of shmget. To do this I had to get the Java program to use my cuckoo version of shmget.

My program

void wto( char * msg) { 
// time_t ltime;
// time(&ltime);
//printf(" the time is %s", ctime(&ltime));
struct __cons_msg cmsg;
int rc;
int cmsg_cmd = 0;
/* fill in the __cons_msg structure */
cmsg.__format.__f1.__msg = msg;
cmsg.__format.__f1.__msg_length = strlen(msg);
rc = __console(&cmsg,NULL,&cmsg_cmd);
}
// this has the same signature as the run time code
cpshmget(
key_t key, size_t size, int shmflg)

{
char buffer[200];
int i, j;
j = sprintf(buffer, ">shmget key %8.8x sz %i flg 0x%8.8x\0", key,size,shmflg);
wto(buffer);
int myresult = shmget(key,size,shmflg);
//sprintf(buffer,"<shmget1 r %i e %i e2 0x%8.8x\0",myresult, errno, __errno2());
//wto(buffer);
//myresult = shmget(key,size,shmflg);
return myresult;
}

I compiled it using a shell script (I found it easier than a make file)

name2=cp 
p1=" -DNDEBUG -O3 -qarch=10 -qlanglvl=extc99 -q64"
p2="-Wc,DLL -D_XOPEN_SOURCE_EXTENDED -D_POSIX_THREADS"
p2="-D_XOPEN_SOURCE_EXTENDED -D_POSIX_THREADS"
p3="-D_OPEN_SYS_FILE_EXT -qstrict "
p4="-Wa,asa,goff -qgonumber -qenum=int"
p5="-I."
p6=""
p7="-Wc,ASM,SHOWINC,ASMLIB(//'SYS1.MACLIB') "
p8="-Wc,LIST(c.lst),SOURCE,NOWARN64,XREF -Wa,LIST,RENT"
/bin/xlc $p1 $p2 $p3 $p4 $p5 $p6 $p7 $p8 -c $name2.c -o $name2.o

It is used as an object .o code – not as an executable module.

Bind it to the Java code

I wanted to cuckoo the module libj9prt29.so .

I saved a copy of the original module libj9prt29.so as libj9prt29.so.orig. I could then include this into the binder, and not worry about any of my old code staying around.

When I needed “a clean run”, without any of my code, I copied libj9prt29.so.orig over libj9prt29.so .

The bind job

//IBMBIND JOB 1,MSGCLASS=H 
// SET BPARM='CASE=MIXED,SIZE=(900K,124K),XREF,RMODE=ANY,CALL=YES'
// SET CPARM='MAP,DYNAM=DLL,LIST=ALL,AMODE=64,TERM=YES'
//BIND EXEC PGM=IEWL,REGION=0M,PARM='&CPARM,&BPARM'
//SYSLIB DD DSN=CEE.SCEEBND2,DISP=SHR
// DD DSN=CBC.SCCNOBJ,DISP=SHR
// DD DSN=SYS1.CSSLIB,DISP=SHR
//Z8921 DD DSN=CEE.SCEELIB(CELQS003),DISP=SHR
//SYSLMOD DD PATH='/usr/lpp/java/J17.0_64/lib/default/',
// PATHDISP=(KEEP,KEEP)
//SYSPRINT DD SYSOUT=*
//SYSLIN DD *
ORDER CELQSTRT
ENTRY CELQSTRT
INCLUDE /u/tmp/java/cp.o
change shmget(cpshmget)
INCLUDE /usr/lpp/java/J17.0_64/lib/default/libj9prt29.so.orig
include Z8921
name libj9prt29.so
//

Notes:

  • You specify SYSLMOD as a directory and specify the “name” later. This was not obvious from the documentation
  • INCLUDE /u/tmp/java/cp.o copies in my code
  • change shmget(cpshmget) says any code which is included after this, cuckoo the entry point shmget to point to cpshmget
  • INCLUDE /usr/lpp/java/J17.0_64/lib/default/libj9prt29.so.orig include the original module
  • include Z8921 = CEE.SCEELIB(CELQS003) contains statements like IMPORT CODE64,CELQV003,’shmget’,280 which defines where shmget is really defined
  • name libj9prt29.so save it as this name in //SYSLMOD

This worked well – but…

I originally had

  wto(buffer); 
int myresult = shmget(key,size,shmflg);
sprintf(buffer,"<shmget1 r %i e %i e2 0x%8.8x\0",myresult, errno, __errno2());
wto(buffer);
//myresult = shmget(key,size,shmflg);

But the wto function, which invokes __console(), sets errno and __errno2. The values passed back to Java were the values from the __console function, not the shmget function.

Issuing the myresult = shmget(key,size,shmflg); a second time set the errno and __errno2 – but if the request was to create, or delete, issuing it a second time gave a different error code. For example if “delete” was specified – the first time worked, the second time gave “not found”, and this confused the Java program calling this function.
What’s going on inside my Java program?

You can use the IBM healthcenter to get information from what is running within Java.

I used Java startup option

-Xhealthcenter
-Dcom.ibm.diagnostics.healthcenter.headless=on
-Dcom.ibm.java.diagnostics.healthcenter.data.collection.level=headless
-Dcom.ibm.java.diagnostics.healthcenter.headless.files.max.size=50000000
-Dcom.ibm.java.diagnostics.healthcenter.headless.delay.start=1
-Dcom.ibm.java.diagnostics.healthcenter.headless.output.directory=/u/tmp/zowe
-Dcom.ibm.diagnostics.healthcenter.readonly=on
-Dcom.ibm.diagnostics.healthcenter.logging.level=fine
-Dcom.ibm.diagnostics.healthcenter.jmx=off
-Dcom.ibm.java.diagnostics.healthcenter.agent.transport=jrmp
-Xtrace:buffers={2m,dynamic}

which are described here.

I used -Dcom.ibm.java.diagnostics.healthcenter.headless.delay.start=1 to wait for a minute before recording, so I didn’t get the Java startup information.

When I started the Java program I got out messages

com.ibm.diagnostics.healthcenter.headless INFO: Headless data collection has started 
com.ibm.diagnostics.healthcenter.headless INFO: Agent will keep last 5 hcd files
com.ibm.diagnostics.healthcenter.headless INFO: Headless collection output directory is /u/tmp/zowec

Shutdown the Java program.

I got a file healthcenter080225_160620_33620365_1.hcd in /u/tmp/zowec.

Download this in binary to your workstation.

Start Eclipse. Window-> Perspective-> Open Perspective-> Other-> Health center profiling

File-> Load Data… Select your downloaded file.

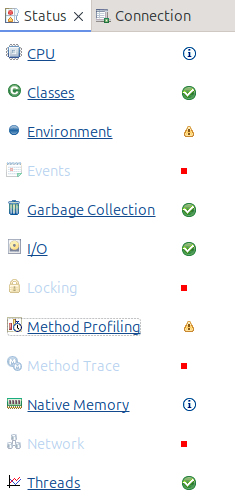
From the status window you can select different views of the data

Method profiling

This display information like

  • Under Tree%this says 18.49 of the time was spent in this class…. including other classes it called
  • Under Self% this is the amount of time spent within just this class. 9.86 of the total time was spent within this class. 15.75 of the total time was spent in just this class. It was recorded in 1617 sample
  • If you select a line, in another part of the display it shows you what called it, and what it called.

CPU

Shows the amount of CPU used over time

Classes

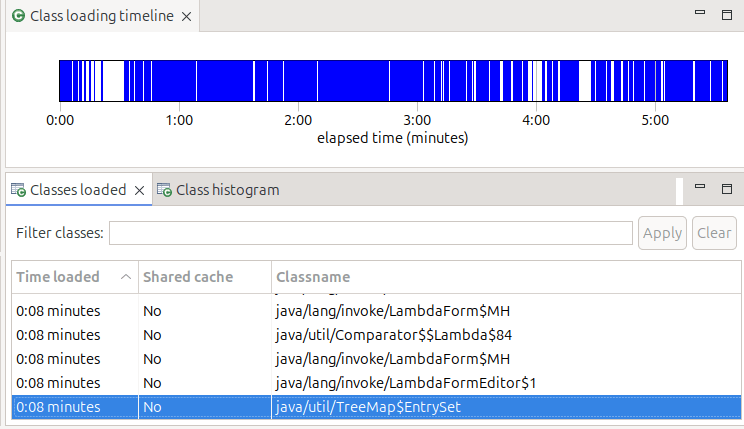
Shows time from start when classes were loaded, and if they were shared classes or not,

Environment

Give you the start option, and information about the JVM

Garbage collection

Gives you a profile and other information on garbage collection

IO

Gives you information about IO. My display said “Your application has opened 45 files and closed 39 files.” It did not tell me which files were opened – it just showed the 6 which were still open, so not very useful!

Using Elliptic Curves is better than RSA – but not as easy

I’ve spent a few days down some rabbit holes trying to solve a problem with an Elliptic Curve, and when I found the answer, I remember I had hit this problem before.

Using an Elliptic Curve generated with

RACDCERT ID( IZUSVR ) GENCERT + 
SUBJECTSDN(CN('CONN2') O('IBM') OU('C2PDFLT')) +
ALTNAME(IP(10.1.1.2))-
WITHLABEL('CONN2.IZUDFLT'), +
NISTECC +
SIZE(521) +

SIGNWITH(CERTAUTH LABEL('DOCZOSCAEC' )) NOTAFTER(DATE(2026/01/01))

I was getting in a Zowe trace

javax.net.ssl.SSLException: No supported CertificateVerify signature algorithm for EC key

This was with TLSv1.3.

In the TLS handshake from Chrome I could see

Supported Groups (5 groups)
Supported Group: Reserved (GREASE) (0x9a9a)
Supported Group: Unknown (0x11ec)
Supported Group: x25519 (0x001d)
Supported Group: secp256r1 (0x0017)
Supported Group: secp384r1 (0x0018)

I’m sure you spotted the problem immediately. The NISTECC SIZE(521) Elliptic Curve has a name of secp521r1, and this is not in the list. At the server, the logic checks that it’s certificate is supported by the groups sent from the client, and so reports

No supported CertificateVerify signature algorithm for EC key

I found Why is secp521r1 no longer supported in Chrome, others?. The article says that the keysize (256) is a strong as keysize(384) – so why bother with keysize(384).

I changed my certificate to keysize(256) and it worked.

What’s C.E.E.1 and which function is this address in?

I had an abend in a module created from C programs, and wanted to know which function had the problem.

In the old days, each function had an eye-catcher and a compile date at the top of each function, so it was easy to scroll upwards towards the start of the dump until you came across the eye-catcher.

And then we had XPLINK… I think the XP link stands for eXtra Performance. The output of the C compiler changed to make it the code more efficient, especially with Java functions. For example:

  • before XPLINK, a call to a function would save all of the registers, update the save area chain – call the module… return and restore the registers afterwards. Some functions were as simple as set this value to 0 – and the overhead of the call was many times the cost of the instructions. The overhead was reduced by only saving what needed to be saved, and passing more parameters in registers.
  • by moving constant data, such as character strings, out of the mainline instructions, meant that sometimes fewer pages were needed for instructions – and so fewer pages were needed in the hardware instruction cache, and so may be faster. Moving the function name and compile time into the “data page” and so into the data cache, was part of this.

The function name etc is available – just not in an obvious place.

What does the code look like?

Meta data is stored in Program Prolog Areas (PPAs)

In the listing, at the start of each XPLINK function is “C.E.E.1”

00000E70    00C300C5 00C500F1 00000080 000000A0a *.C.E.E.1.....

At offset 00000080 from 00000E70 is a block of storage (PPA1) which identifies this function.

0006D8  02           =AL1(2)            Version 
0006D9 CE =AL1(206) CEL signature
...
0006F0 0003 AL2(3),C'pit'
0006F8 FFFFF9C0 =F'-1600' Offset to Entry Point Marker
  • At offset 0 is 0x02… so you know you are in the right control block
  • At offset 2 is 0xCE
  • At offset 10 is the code length
  • At offset 18 is 2 bytes of length, followed by the function name, possibly with up to 3 bytes of padding to align the next field on a 4 byte work boundary.
  • (Sometimes,) after this, the offset will vary because the name length is variable, is a field like 0XFF… such as FFFFFA60. This is – 0x5a0 (-1440). The address of this section (the 0x02) minus this value gets you to the C.E.E.1. This does not always seem to work!

The start of the function “pit” is at x6d8 – 1600 = x6d8 -x640 = x98

At this address in the listing was

                                *  void pit() 
000098 00C300C5 DC =F'12779717' XPLink entrypoint marker
00009C 00C500F1 DC =F'12910833'
0000A0 00000640 DC =F'1600'
0000A4 00000080 DC =F'128'
0000A8 pit DS 0D
* Start of executable code
0000A8 9049 4780 STM r4,r9,1920(r4) .....

Note the value’s 1600 and -1600 tie up.

So not too difficult to find the name of the function.

Ripping the covers off Java and seeing what’s configured

I needed to see what definitions were being used by Java applications like z/OSMF and Zowe. I could not find an easy way, so I had to resort to taking a dump!

Use the Unix command ps -ef to display all of the Unix threads, and what they are running

For example

IBMUSER:/global/zosmf/configuration: >ps -ef  |grep zosmf                                                                         
OMVSKERN 50397205 83951638 - 18:36:28 ? 6:48 /usr/lpp/zosmf/liberty/lib/native/zos/s390x/bbgzsrv --clean zosmfServer
IZUSVR 50397230 50397231 - 18:36:18 ? 0:00 /usr/lpp/zosmf/liberty/lib/native/zos/s390x/bbgzangl COLD=N NAME=IZUANG1

Send a command to take a dump

kill -QUIT 50397205

This created a dump START1.JVM.IZUSVR0.D250206.T184027.X001 and a file /global/zosmf/data/logs/zosmfServer/javacore.20250206.184027.50397205.0002.txt

The .txt file is human readable, and may have all the data you need.

Extract information from the binary dump

Use the same Java as the application was using

  1. Copy the dump dataset (known as a TRANSACTION DUMP) to a Unix file, such as dump
    cp "//'START1.JVM.IZUSVR0.D250206.T184027.X001 '" dump
  2. extract a java dump from TRANSACTION DUMP using /usr/lpp/java/J11.0_64/bin/jextract dump -v, this creates a dump.zip
  3. Use the jdmpview to look at the dump.
  4. Run dump viewer /usr/lpp/java/J11.0_64/bin/jdmpview -J-Xmx768m -zip dump.zip
  5. Run info thread in jdmpview to display information about current thread java/native stack trace.

Why didn’t my Elliptic Curve certificate work all the time?

I had created a certificate on z/OS, signed it with a CA, and it seemed that I could use in in some scenarios, but not when Java was involved. Sometimes when Java was involved, the Java program just hung!

The short answer.

After several weeks on and off, I found a reference saying an EC curve needs a CA which is also an EC. Having a EC certificate with an RSA certificate in the chain can cause problems!

I changed my CA, (and distributed it to all my clients) and it worked!

I also had to increase the length of the key…

The medium length answer

The definition which worked

RACDCERT ID( IZUSVR ) GENCERT + 
SUBJECTSDN(CN('CONN2') O('IBM') OU('C2PDFLT')) +
ALTNAME(IP(10.1.1.2))-
WITHLABEL('CONN2.IZUDFLT'), +
NISTECC SIZE(521) +
SIGNWITH(CERTAUTH LABEL('DOCZOSCAEC' )) NOTAFTER(DATE(2026/01/01))
RACDCERT ALTER(LABEL('CONN2.IZUDFLT')) ID(IZUSVR) TRUST

With a CA

RACDCERT GENCERT  -                                             
CERTAUTH -
SUBJECTSDN(CN('DocZosCAECC')-
O('ECC') -
OU('CA')) -
NOTAFTER( DATE(2027-07-02 ))-
KEYUSAGE( CERTSIGN ) -
NISTECC SIZE(521) -
WITHLABEL('DOCZOSCAEC')

The long and interesting answer

My debug trail was along the path of taking a System SSL trace, formatting it, and looking at the return code – to find a blog post I had written about the same return code.

With the chrome browser you can give a url chrome://net-export, and chrome will trace the flow.

You

  • start the trace
  • run the workload
  • stop the trace and save the file
  • use “The log file can be loaded using the netlog_viewer.” Click on the link.
  • drop your file onto the tools.
  • pick events
  • I found the last line of output to my server. It was like
  • Tick the box at the front of the line.

This gave me

2222: SOCKET
https://10.1.1.2:7557 <https://10.1.1.2 same_site>
Start Time: 2025-02-04 08:49:00.638

t=10890 [st= 0] +SOCKET_ALIVE [dt=128]
--> source_dependency = 2213 (SSL_CONNECT_JOB)
t=10890 [st= 0] +TCP_CONNECT [dt=8]
--> address_list = [
"10.1.1.2:7557"
]
--> aliases = []
t=10890 [st= 0] TCP_CONNECT_ATTEMPT [dt=8]
--> address = "10.1.1.2:7557"
t=10898 [st= 8] -TCP_CONNECT
--> local_address = "10.1.0.2:51284"
--> remote_address = "10.1.1.2:7557"
t=10898 [st= 8] +SSL_CONNECT [dt=119]
t=10900 [st= 10] SSL_HANDSHAKE_MESSAGE_SENT
...
t=11016 [st=126] SSL_HANDSHAKE_MESSAGE_RECEIVED
--> bytes =
... 1]T
--> type = 15
t=11016 [st=126] SSL_CERTIFICATES_RECEIVED
--> certificates =
-----BEGIN CERTIFICATE-----
...
-----END CERTIFICATE-----

t=11017 [st=127] SOCKET_BYTES_SENT
--> byte_count = 30
t=11017 [st=127] SSL_ALERT_SENT
--> bytes =
02 2F ./
t=11017 [st=127] SSL_HANDSHAKE_ERROR
--> error_lib = 16
--> error_reason = 245
--> file = "../../third_party/boringssl/src/ssl/extensions.cc"
--> line = 451
--> net_error = -107 (ERR_SSL_PROTOCOL_ERROR)
--> ssl_error = 1

This lead me to Feature: Deprecate TLS SHA-1 server signatures. This says Chrome is removing support for signature algorithms using SHA-1 for server signatures during the TLS handshake. This does not affect SHA-1 support in server certificates, which was already removed, or in client certificates, which continues to be supported.

This didn’t help me, but a link from a link from one hit mentioned the CA also needs to be an Elliptic Curve.