One minute networking: IPV6 Multi cast for people who do not want to know the details.

I picture IP multicast as groups in whatsapp, or to send a packet of data to all endpoints under a node in the network.

The maximum group is the top 104 bits of an IP V6 TCPIP address – or, to put it a different way, having a different right 24 bits.

With an IP address of 2001:0123:4567:89ab:cdef:0123:4567:89ab the maximum group is 2001:0123:4567:89ab:cdef:0123:45..:…. to send a packet to members of the group you use address ff02:0000:0000:0000:0000:0001:ff.:…. or (in abbreviated form) ff02::1:ff .

There are different groups. One of my interfaces is a member of the following “groups”

  • ff01::1 all nodes
  • ff02::2 all routers
  • ff02::1:ff67:89ab this is a group for this specific address. When an interface is started, it sends a packet saying “does anyone have this address 67:89ab” to the group ff02::1:ff67:89ab. If there is a reply – then the value you are using is a duplicate. This is known as DAD Duplicate Address Detection.
  • ff02::fb multicast DNS IPv6

IP V4

When an IP V4 interface starts it broadcasts (similar to multicast) “ARP: I am address 10.1.1.2, this is my MAC address, and I my status is UP”

Displaying multicast information on Linux

linux netstat –groups

This gives information like

IPv6/IPv4 Group Memberships
Interface RefCnt Group
--------------- ------ ---------------------
lo 1 mdns.mcast.net
lo 1 all-systems.mcast.net
eno1 1 mdns.mcast.net
eno1 1 all-systems.mcast.net
...
lo 1 ff02::fb
lo 1 ip6-allnodes
lo 1 ff01::1
eno1 1 ff02::fb
eno1 1 ff02::1:ffa8:b879
eno1 1 ip6-allnodes
eno1 1 ff01::1
...

Where ip6-allnodes is ff02::1

For z/OS

For an interface with addresses 2001:db8:8::f and 2001:DB8::0067:89ab
TSO NETSTAT DEVLINKS

IntfName: JFPORTCP6         IntfType: IPAQENET6  IntfStatus: Ready 
...
Multicast Specific:
Multicast Capability: Yes
Group: ff02::1:ff67:89ab
RefCnt: 0000000001 SrcFltMd: Exclude
SrcAddr: None
Group: ff02::1:ff00:4
RefCnt: 0000000001 SrcFltMd: Exclude
SrcAddr: None
Group: ff02::1:ff00:9
RefCnt: 0000000001 SrcFltMd: Exclude
SrcAddr: None
Group: ff02::1:ffa2:a2a2
RefCnt: 0000000001 SrcFltMd: Exclude
SrcAddr: None
Group: ff01::1
RefCnt: 0000000001 SrcFltMd: Exclude
SrcAddr: None
Group: ff02::1
RefCnt: 0000000001 SrcFltMd: Exclude
SrcAddr: None
  • ff02::1:ff67:89ab is a group for the address 2001:DB8::0067:89ab
  • ff02::1:ff00:9 is group for the address with 2001:db8:8::9
  • ff01::1 is for all nodes.

Issuing the first ping

I have a laptop connected to a server over Ethernet. The laptop had address 2001:7::1, and the server had IP address 2001:7::2. I defined a route from the laptop to the server

The first time an IP address 2001:7::2 was used on the laptop, there was a flow to all nodes ff02::1:ff, for address 2001:7::2, and a response from 2001:7::2

2001:7::1 ff02::1:ff00:2 ICMPv6 Neighbor Solicitation for 2001:7::2 from ...
2001:7::2 2001:7::1 ICMPv6 Neighbor Advertisement 2001:7::2 (sol, ovr) is at ...

This sends a request from 2001:7::1 to all routers asking “does any one have address 2001:7::2”. Device 2001:7::2 advertises to 2001:7::1 “I have the address”.

Configuring and using the RMF GPM Server

RMF provides information on the usage of system resources, such as CPU, Channel usage, Disk response time etc. You can get reports from an attached 3270 screen, from a web server, and from a REST request.

For the web server and REST requests, you need the GPM server running. It took me a while to get this running, and to get useful data out of it.

GPMServer uses basic authority checking of userid and password. Alternatively it can use certificates from the client to authenticate on z/OS.

There are two versions of GPMSERVE. It looks like the newer one is written in Java. I only have access to the old version.

GPM Setup

I used

//GPMSERVE PROC MEMBER=00 
//STEP1 EXEC PGM=GPMDDSRV,REGION=128M,TIME=1440,
// PARM='TRAP(ON)/&MEMBER'
//* PARM='TRAP(ON),ENVAR(ICLUI_TRACETO=STDERR)/&MEMBER'
//*
//*STEPLIB DD DISP=SHR,DSN=CEE.SCEERUN
//* DD DISP=SHR,DSN=CBC.SCLBDLL
//GPMINI DD DISP=SHR,DSN=SYS1.SERBPWSV(GPMINI)
//GPMHTC DD DISP=SHR,DSN=SYS1.SERBPWSV(GPMHTC)
//GPMPPJCL DD DISP=SHR,DSN=SYS1.SERBPWSV(GPMPPJCL)
//CEEDUMP DD SYSOUT=*
//SYSPRINT DD SYSOUT=*
//SYSOUT DD SYSOUT=*
// PEND

CACHESLOTS(4)                   /* Number of timestamps in CACHE     */ 
DEBUG_LEVEL(3) /* informational messages */
SERVERHOST(10.1.1.2)
HTTPS(ATTLS) /* AT-TLS setup required */
MAXSESSIONS_HTTP(20) /* MaxNo of concurrent HTTP requests */
HTTP_PORT(8803) /* Port number for HTTP requests */
HTTP_ALLOW(*) /* Mask for hosts that are allowed */
HTTP_NOAUTH() /* No server can access without auth.*/
CLIENT_CERT(NONE)
/* CLIENT_CERT(ACCEPT) */

The essence of my AT-TLS definitions is (from my Easy-ATTLS)

LocalPortRange : 8803
Direction : Both
ApplicationControlled : Off
TTLSEnabled : On
CtraceClearText : On
Trace : 2
HandshakeRole : Server
Keyring : start1/TN3270
TLSv1.1 : Off
TLSv1.2 : On
TLSv1.3 : Off
HandshakeTimeout : 3
ClientECurves : Any
ServerCertificateLabel : NISTECCTEST
V3CipherSuites : [
1302 TLS_AES_256_GCM_SHA384,
1301 TLS_AES_128_GCM_SHA256,
003D TLS_RSA_WITH_AES_256_CBC_SHA256,
C02C TLS_ECDHE_ECDSA_WITH_AES_256_GCM_SHA384,
]

I used CtraceClearText : On so I could trace the flows and see the encrypted traffic.

The Chrome browser used ECDHE* cipher specs. I had specified C02C TLS_ECDHE_ECDSA_WITH_AES_256_GCM_SHA384, and I could this was being used.

The Chrome browser prompted for userid and password which was passed up to the server.

Issuing commands

You start the server with

S GPMSERVE

If it abends with

IEF450I GPMSERVE GPMSERVE - ABEND=S0C4 U0000 REASON=00000011

Check RMF is active. And check you have issued F RMF,START III to start the data collection.

You stop the server

p gpmserve

You can display information about the server

f gpmserve,display

The newer version of GPMSERVE uses commands like F GPMSERVE,APPL=DISPLAY

The output is like

+GPM062I DDS-REFR 01/02 084125 CYCLE=314. WAITING 10 SEC
+GPM062I HTTP-LIS 01/02 084119 MAX=20 ACTIVE=0 SUSPEND=1
+GPM062I RMF_DDS_ATTLS 01/02 074900 STARTING …
+GPM062I RMF_DDS_OPTS 01/02 074900 STARTING …
+GPM062I HTTP-CLI 01/02 083219 ::FFFF:10.1.0.2 TERMINATED. SUSPENDED.

Where 01/02 is Jan 2nd. 074900 is 07:49:00

Certificate and keyring set up

I reused an existing keyring. The AT-TLS definitions give the keyring is start1/TN3270 and the certificate to use is NISTECCTEST.

List the ring contents

tso RACDCERT listring(TN3270) id(START1)

The keyring included the CA for my NISTECCTEST certificate, and the CA for the client’s certificate (on Linux).

My certificate authentication to work, I needed the client certificate connected to the keyring.

On Linux I had

  • ca256.pem the Certificate Authority
  • colinpaice.pem

I FTPed these to z/OS as VB data sets, COLIN.CA256.PEM, and COLIN.PAICE.PEM.

Import the CA into z/OS

//IBMRACFI JOB 1,MSGCLASS=H 
//S1 EXEC PGM=IKJEFT01,REGION=0M
//SYSPRINT DD SYSOUT=*
//SYSTSPRT DD SYSOUT=*
//SYSTSIN DD *
RACDCERT CHECKCERT('COLIN.CA256.PEM')
RACDCERT DELETE -
(LABEL('CA256')) CERTAUTH
RACDCERT CERTAUTH ADD('COLIN.CA256.PEM') -
WITHLABEL('CA256') TRUST
RACDCERT CERTAUTH LISTCHAIN(LABEL('CA256'))

RACDCERT CONNECT(CERTAUTH LABEL('CA256') -
RING(TN3270) ) ID(START1)
SETROPTS RACLIST(DIGTNMAP, DIGTCRIT) REFRESH
/*

and import the users .pem file.

//IBMRACFI JOB 1,MSGCLASS=H 
//S1 EXEC PGM=IKJEFT01,REGION=0M
//SYSPRINT DD SYSOUT=*
//SYSTSPRT DD SYSOUT=*
//SYSTSIN DD *
RACDCERT CHECKCERT('COLIN.PAICE.PEM')
RACDCERT DELETE -
(LABEL('RMFCERT')) ID(COLIN)
RACDCERT ID(COLIN) ADD('COLIN.PAICE.PEM') -
WITHLABEL('RMFCERT') TRUST
RACDCERT ID(COLIN) LISTCHAIN(LABEL('RMFCERT'))
RACDCERT ID(START1) CONNECT(ID(COLIN ) LABEL('RMFCERT') -
RING(TN3270))
SETROPTS RACLIST(DIGTNMAP, DIGTCRIT) REFRESH
/*

When a user connects with a certificate, GPMSERVE looks in the keyring for the passed certificate, and finds the userid for it.

Setting up the security profiles

You need to set up a CLASS(APPL) profile for GPMSERVE. Give any authorised userids read access to the profile.

//IBMRACF  JOB 1,MSGCLASS=H 
//S1 EXEC PGM=IKJEFT01,REGION=0M
//SYSPRINT DD SYSOUT=*
//SYSTSPRT DD SYSOUT=*
//SYSTSIN DD *
* Delete and redefine the profile
* List it first
RLIST APPL GPMSERVE authuser
RDELETE APPL GPMSERVE
SETROPTS RACLIST(APPL) refresh
RDEFINE APPL GPMSERVE UACC(NONE) NOTIFY(COLIN)
PERMIT GPMSERVE CLASS(APPL) ID(IBMUSER) ACCESS(READ)
PERMIT GPMSERVE CLASS(APPL) ID(COLIN ) ACCESS(READ)
PERMIT GPMSERVE CLASS(APPL) ID(ADCDB ) ACCESS(NONE)
SETROPTS RACLIST(APPL) refresh
RLIST APPL GPMSERVE authuser
SETROPTS RACLIST(APPL) refresh
/*

I specified RDEFINE APPL GPMSERVE UACC(NONE) NOTIFY(COLIN) so the userid COLIN gets notified if anyone tries to use the profile and fails. Using WARNING does not work.

Changing security

If you give a userid read permission to the CLASS(APPL) GPMSERVE profile, you need to stop and restart GPMSERVE to pick up the changes. It looks like GPMSERVE caches the access after first use, and there is no refresh security command.

When tracing a job it helps to trace the correct address space.

The title When tracing a job it helps to trace the correct address space is a clue – it looks obvious, but the problem was actually subtle.

The scenario

I was testing the new version of Zowe, and one of the components failed to start because it could not find a keyring. Other components could find it ok. I did a RACF trace and there were no records. The question is why were there no records?

The execution environment.

I start Zowe with S ZOWE33. This spawns some processes such as ZOWE335. This runs a Bash script which starts a Java program.

I start a GTF trace with

s gtf.gtf,m=gtfracf
#set trace(callable(type(41)),jobname(Zowe*))

Where callable type 41 is for r_datalib services to access a keyring.

No records were produced

What is the problem?
Have a few minute pause to think about it.

Solution

After 3 days I stumbled on the solution – having noticed, but ignored the evidence. I wondered if the Java code to process keyrings, did not use the R_datalib API, I wondered if Java 21 uses a different jar file for processing keyrings – yes – but this didn’t solve the problem.

The solution was I should have been tracing job ZWE33CS! Whoa – where did that come from?

The Java program was started with

_BPX_JOBNAME=ZWE33CS /usr/lpp/java/J21.0_64/bin/java

See here which says

When a new z/OS® UNIX process is started, it runs in a z/OS UNIX initiator (a BPXAS address space). By default, this address space has an assigned job name of userIDx, where userID is the user ID that started the process, and x is a decimal number. You can use the _BPX_JOBNAME environment variable to set the job name of the new process. Assigning a unique job name to each … process helps to identify the purpose of the process and makes it easier to group processes into a WLM service class.

If I use the command D A,L it lists all of the address spaces running on the system. I had seen the ZOWE33* ones, and also the ZWE* ones – but ignored the ZWE* ones. Once I knew the solution is was so obvious.

What is my Unix process doing?

I was familiar with the USS command ps -ef which displays output like

     UID        PID       PPID  C    STIME TTY       TIME CMD 
WEBSRV 16842766 1 - 07:23:05 ? 0:00 -sh -c /web/httpd1/bin/apachectl -k start -f /web/httpd1/conf/httpd.conf -DNO_f

For Zowe threads I was getting

/u/tmp/zowep33//bin/utils/configmgr -script /u/tmp/zowep33//bin/commands/inter

which was annoyingly truncated.

The command ps -e -o args > aa gives the whole command line (up to 1024 bytes) such as

/u/tmp/zowep33//bin/utils/configmgr -script /u/tmp/zowep33//bin/commands/internal/start/component/cli.js

Another useful command when you know it.

How do I logon to ISPF and allocate my data sets?

Yes, I know you do not logon to ISPF, but the title is shorter than how do I logon to TSO, and start ISPF so my data sets are allocated as I want them.
I wrote this blog post because I was trying to use ISMF and save information into ISPF tables, but I could not use the information in the tables because my table data set was not in the ISPTLIB concatenation.

When I used TSO ISRDDN to display the data sets allocated to my TSO session I had

ISPTABL -> COLIN.S0W1.ISPF.ISPPROF
ISPTLIB -> ISP.SISPTENU
-> SYS1.DGTTLIB
-> SYS1.SBLSTBL0
...

COLIN.S0W1.ISPF.ISPPROF was not in the list of data sets in the ISPTLIB concatenation.

This lead me to the question – how do I add COLIN.S0W1.ISPF.ISPPROF to the ISPTLIB concatenation?

How do I allocate my datasets to ISPF

When I logon to ISPF I get

------------------------------- TSO/E LOGON -----------------------------------


Enter LOGON parameters below: RACF LOGON parameters:
Userid ===> COLIN
Password ===>
Procedure ===> ISPFPROC Group Ident ===>
Acct Nmbr ===> ACCT#
Size ===> 2096128
Perform ===>
Command ===> ex 'colin.zlogon.clist'

You can influence what happens by specifying a different Procedure, or specifying a command in Command.

The PROCEDURE ===> ISPFPROC is JCL to start a TSO address space and allocate system wide datasets.

Once ISPF has started, you can issue the command TSO ISRDDN to display all of the datasets allocated to TSO.
The ISRDDN command member ISPFPROC will find and show you which of the allocated data sets contain the member.
it gave me

                           Current Data Set Allocation         Member was found
Command ===> Scroll ===> PAGE

Message Act DDname Data Set Name Actions: B E V M F C I Q
Member: ISPFPROC >_ SYSPROC ADCD.Z31B.PROCLIB

You can enter the B command in the >_ field to browse the member directly

Aside:

The Actions: B E V M F C I Q are commands for

  • B Browse the first sixteen data sets or a single data set.
  • E Edit the first sixteen data sets or a single data set.
  • V View the first sixteen data sets or a single data set.
  • M Show an enhanced member list for the first sixteen data sets or a single data set.
  • F Free the entire DDNAME.
  • C Compress a PDS using the existing allocation.
  • I Provide additional data set information.
  • Q Display list of users or jobs using a data set.

Browse the member

This member has

//********************************************************************    
//*
//* ISPF FULL-FUNCTION LOGON PROC
//*
//*********************************************************************
//ISPFPROC PROC ROOT='/usr/lpp/zosmf' /* ZOSMF INSTALL ROOT */
// EXPORT SYMLIST=(XX)
// SET QT=''''
// SET XX=&QT.&ROOT.&QT.
//ISPFPROC EXEC PGM=IKJEFT01,REGION=0M,DYNAMNBR=200,
// PARM='%ISPFCL'
//CEEOPTS DD *,SYMBOLS=JCLONLY
ENVAR("PATH=/bin:&XX./bin")
//SYSUADS DD DISP=SHR,DSN=SYS1.UADS
//SYSLBC DD DISP=SHR,DSN=SYS1.BRODCAST
//SYSPROC DD DISP=SHR,DSN=USER.&SYSVER..CLIST
// DD DISP=SHR,DSN=FEU.&SYSVER..CLIST
// DD DISP=SHR,DSN=ADCD.&SYSVER..CLIST
// DD DISP=SHR,DSN=ISP.SISPCLIB
...
//ISPTLIB DD DISP=SHR,DSN=ISP.SISPTENU
// DD DISP=SHR,DSN=SYS1.DGTTLIB
...
//SDSFMENU DD DSN=ISF.SISFPLIB,DISP=SHR
//ISPTABL DD DSN=SYS1.SMP.OTABLES,DISP=SHR

This JCL

  • creates the environment PATH=/bin/:/usr/lpp/zosmf/bin
  • Allocates lots of data sets, for example SYSPROC has USER…..CLIST depending on the value of the global symbol &SYSVER (Z31B at the moment). If I IPL a different level of z/OS it may have a different level, such as Z24C
  • Allocates fixed name data sets such as ISP.SISPCLIB
  • Allocates lots of ISPF tables for input
  • Allocates an SDSF menu data set
  • Allocates a table ISPTABL for ISPF
  • But does not allocate an ISPTABL for my personal tables.

In the JCL it has

//ISPFPROC EXEC PGM=IKJEFT01,REGION=0M,DYNAMNBR=200,          
// PARM='%ISPFCL'

Which says invoke TSO (IKJEFT01) and execute the %ISPFCL Clist (or REXX).

Use PF3 to return from ISRDDN.

Where is ISPFCL?

The above JCL uses CLIST/REXX ISPFCL as a profile to do additional processing, such as allocating additional data sets.

You could allocate datasets in the ISPF JCL instead of through the CLIST – but the CLIST allows conditional processing, such as if the ISPFPROF data set does not exist, then allocate it.

You can use TSO ISRDDN again and specify member ISPFCL . The member was found, in four places (see the Member: below)

                           Current Data Set Allocations           Row 98 of 118
Command ===> _____________________ Scroll ===> PAGE

Message Act DDname Data Set Name Actions: B E V M F C I Q
Member: ISPFCL >_ SYSPROC USER.Z31B.CLIST
>_ FEU.Z31B.CLIST
Member: ISPFCL >_ ADCD.Z31B.CLIST
>_ ISP.SISPCLIB
Member: ISPFCL >_ USER.Z31B.PROCLIB
>_ FEU.Z31B.PROCLIB
Member: ISPFPROC >_ ADCD.Z31B.PROCLIB
>_ ISM403.SFMNEXEC
>_ AUT430.SINGREXX
>_ SYSUADS SYS1.UADS
>_ SYSUDUMP ---------- JES2 Subsystem file -------------

The member is found in 4 places. You can browse a member by entering B in the >_

The first ISPFCL member has

PROC 0 VOL(B3SYS1)                                                       
CONTROL NOMSG NOFLUSH ASIS
PROFILE NOMODE MSGID PROMPT INTERCOM WTPMSG
WRITE *****************************************************************
...
FREE FILE(ISPPROF ISPTABL)
SET &SDSFTAB= &STR(&SYSUID..SDSF.ISFTABL)
ALLOC DA('&SDSFTAB') SHR FILE(ISFTABL)

SET &DSNAME = &STR(&SYSUID..&SYSNAME..ISPF.ISPPROF)
ALLOC DA('&DSNAME') SHR FILE(ISPPROF)
ALLOC DA('&DSNAME') SHR FILE(ISPTABL)
IF &LASTCC ¬= 0 THEN DO
/* Allocate the ISPF Prof dataset */
...
END
  • The FREE FILE(ISPPROF ISPTABL) says drop (ignore) the existing definitions for ISPPROF and ISPTABL. The CLIST will reallocate them.
  • The ALLOC DA(‘&DSNAME’) SHR FILE(ISPTABL) allocates my dataset to the ISPTABL ddname.
  • The problem is that you cannot easily concatenate my data sets to the ISPTLIB concatenation. You can use the TSO ALLOCate command to allocate a list of data sets to a DDNAME, but not just to add one data set to an existing allocated DDNAME. See Adding a data set to an existing DDNAME in TSO.

Starting ISPF

When you logon to the TSO Logon panel it has

Command   ===> ex 'colin.zlogon.clist'       

The command (if specified) will be processed after any command found in the PARM field of the EXEC JCL statement in your logon procedure.

You can specify ISPF, a clist, or other command.
If you want to invoke ISPF from your clist you will need to invoke the ISPF command for example

/* Rexx */                                                        
trace r
say "in colin.zlogon.clist"
address TSO

"alloc fi(ISPTLIB) DA('COLIN.S0W1.ISPF.ISPPROF') SHR "
zl =userid.SDSF.isftabl /* so we get colin.zlogon.clist */
if SYSDSN(zl) = OK then
do
"alloc fi(isftabl) da('"zl"') shr reus"
end
req = "ALLOC FI(tmp) DA('COLIN.S0W1.ISPF.ISPPROF') SHR "
if bpxwdyn(req ) =0 then
call bpxwdyn "concat ddlist(ISPTLIB,tmp) "
"ispf"

With this, ISPF starts with my data sets allocated as I want them!

Adding a data set to an existing DDNAME in TSO.

I wanted to add a data set to the already allocated ISPTLIB concatenation. You can use the TSO ALLOCate command to allocate a list of data sets, but not to add a data set to an existing definition.

Lionel B. Dyck pointed me to the TSO function bpxwdyn.

When I logon to TSO I invoke a userid.ZLOGON.REXX data set

/* Rexx */                                                              

address TSO
userid = userid()
dsn= userid".S0W1.ISPF.ISPPROF"
req = "ALLOC FI(tmp) DA('"dsn"') SHR "
if bpxwdyn(req ) =0 then
call bpxwdyn "concat ddlist(ISPTLIB,tmp) "

"ispf"
  • The bpxwdyn(req ) allocates the dataset to the DDNAME TMP.
  • The call bpxwdyn “concat ddlist(ISPTLIB,tmp) copies the data set(s) in the tmp DDNAME to the end of the ISPTLIB DDNAME
  • ispf starts ISPF.

The TSO ISRDDN command gave me

                          Current Data Set Allocations           Row 68 of 122
Command ===> Scroll ===> CSR

Volume Disposition Act DDname Data Set Name Actions: B E V M F C I Q
B3RES1 SHR,KEEP > ISPTLIB ISP.SISPTENU
...
A4USR1 SHR,KEEP > COLIN.S0W1.ISPF.ISPPROF

Easy once you know how.

On the CBTAPE are KONCAT and CONCAT which do a similar function.

Using the Java Health centre for looking into Z/OSMF, MQWEB and other Liberty products.

The Java Health centre has an agent running in the JVM of interest, and there is Eclipse plug-in to display the data.

A Java server such as Liberty ( as used in z/OSMF, z/OSMF and MQWEB) can provide information on how the server is running. I was running MQWEB with Openj9, Java 21 (Semeru).

You need to configure the Liberty server and have something to process the data such as Health Center running on Eclipse.

You can display information in graphical time line format, such as

  • CPU used, system and application as used by the JVM
  • Which classes are being used
  • The environment – such as the parameters used to start the JVM
  • Garbage collection activity
  • I/O – number of files open, and open activity
  • Method profiling
  • Threads in use.

Configure the Eclipse

I installed Health Center from the Market place.

How to collect the data

You can configure the JVM in different modes:

  • headless – data is collected and written to the local file system
  • collect from the start – and view in Eclipse, this means you get all of the Java class loading activity
  • start collecting only after Eclipse has started, and connected to the JVM. I use this method. I start my server, and run a workload to “warm up the JVM” then use Eclipse to show the activity due to my testing.

Configure the JVM server

The options are listed here.

You can specify the JVM options on the command line or the jvm.options file.

You can specify them on the -Xhealthcenter:… statement, or as

-Dcom.ibm.diagnostics.healthcenter...=... 

values. For example

-Xhealthcenter:level=off,readonly=off,jmx=on,port=1972 

or

-Xhealthcenter:level=off
-Dcom.ibm.java.diagnostics.healthcenter.agent.port=1972
-Dcom.ibm.diagnostics.healthcenter.jmx=on
-Dcom.ibm.diagnostics.healthcenter.readonly=on

To run headless

In the server

I added the following to my jvm.options

-Xhealthcenter:level=headless 
-Dcom.ibm.java.diagnostics.healthcenter.headless.delay.start=2
-Dcom.ibm.diagnostics.healthcenter.headless=on
-Dcom.ibm.java.diagnostics.healthcenter.data.collection.level=headless
-Dcom.ibm.java.diagnostics.healthcenter.headless.output.directory=/u/tmp/zowec/
-Dcom.ibm.diagnostics.healthcenter.readonly=on

Down load the files to your work station, and use File -> Load Data to process the files.

To run the Health centre in real time

In the server

-Xhealthcenter:level=off,readonly=off,jmx=on,port=1972 
-Dcom.ibm.diagnostics.healthcenter.logging.level=debug

Note the jmx=on and the port number. You need this for the Eclipse configuration. The level=off means do not start collecting data until the Health centre agent connects.

In Eclipse

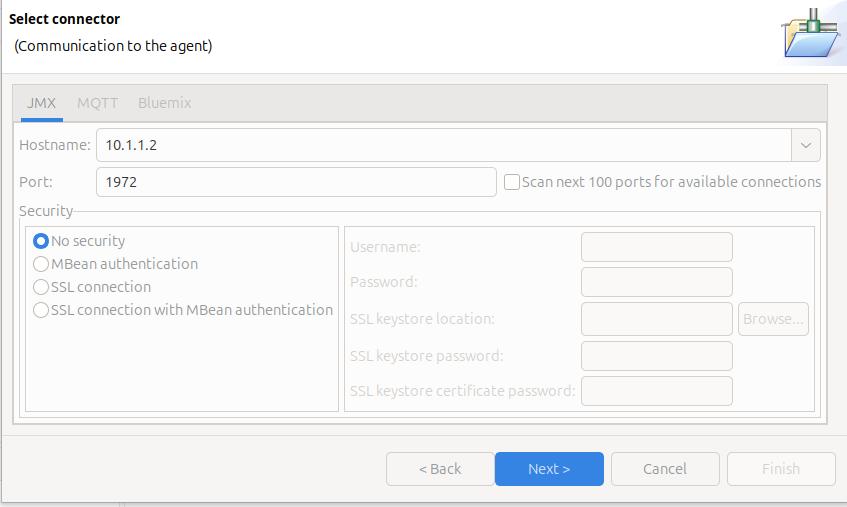
File -> New Connection… -> Enable an application for monitoring -> Next.

On the Select connector panel I used

Once it worked, I enabled security.

Click Next

The Health Centre then starts searching at the specified port. I disable the Scan next 100 ports… When it manages to connect to the port, click Finish.

I initially had problems connecting to the server, see Why can’t I connect to a z/OS port?

It takes a few seconds to start the data collection, and start downloading the data.

Let the JVM warm up

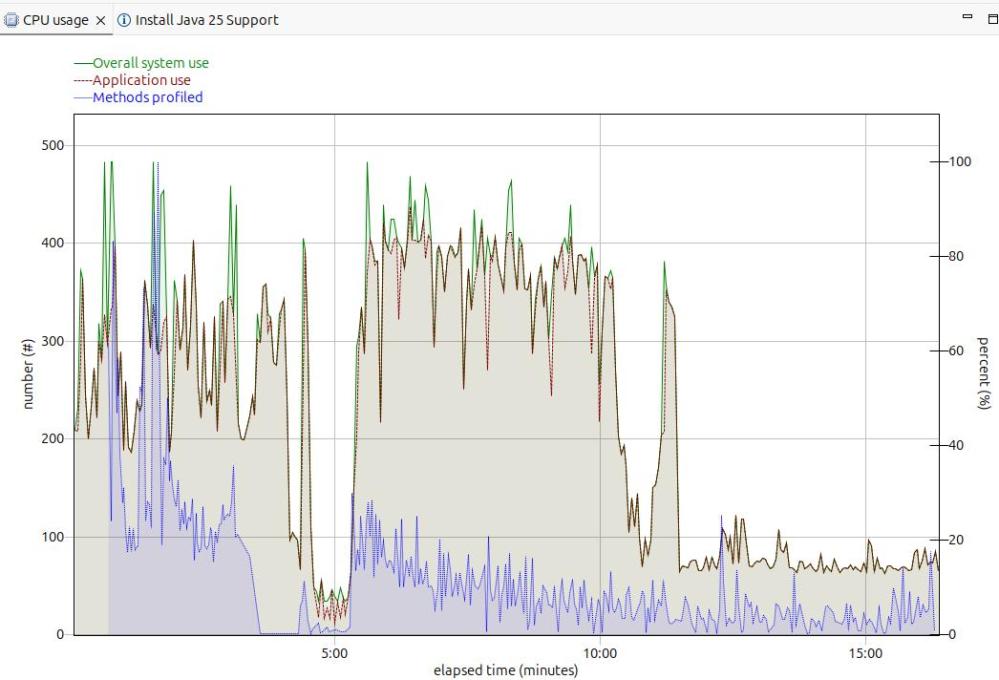
The image below shows the CPU usage from the start of the server.

For the first 5 minutes, this is the JVM starting up with no workload. Afterwards the CPU used drops to a low value.

After 5 minutes, I started my workload. For the first 12 or so minutes the CPU is high, but after about 13 minutes it levels out. If you want to do any measurements of cost per transaction you should take them from this period. During the “warm up” period, the JVM is optimising the code etc.

The green line shows the system CPU usage. The red line (and grey area) shows the Application usage. We can see most of the CPU used is application usage.

The number of methods profiled is the JVM optimising the code. It takes the “hottest” classes and does those first… until all (most) of the classes are optimised.

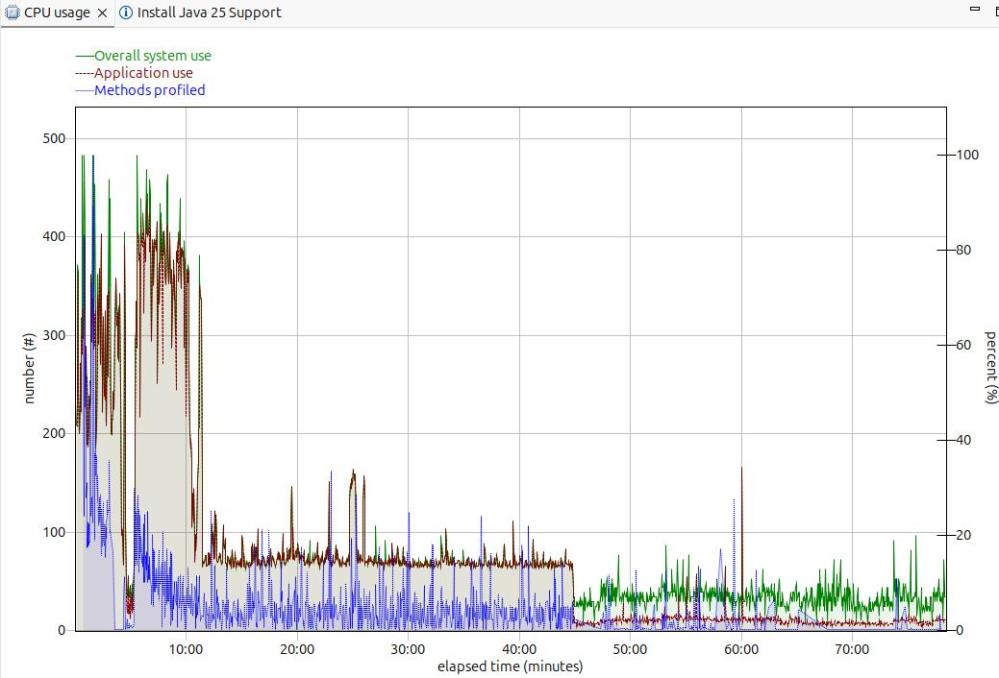
Long term monitoring.

f

From this diagram you can see the JVM startup, the initial part of my test where the JVM was warming up, the remainder of the test, and the JVM overhead after the test.

You need to take all of these into consideration when running performance tests.

Running performance tests

I set up my Work Load Manager configuration to record the number of MQ transactions, and had a report class for the MQWEB server. From this I can calculate the cost per transaction.

Health centre agent logging

With

-Dcom.ibm.diagnostics.healthcenter.logging.level=finest

I had output in the STDERR output

[06:51:52] com.ibm.diagnostics.healthcenter.Agent FINE: System receiver, version 1.0 
[06:51:52] com.ibm.diagnostics.healthcenter.Agent FINE: /usr/lpp/java/J21.0_64//lib/libhcapiplugin.so, version 1.0
[06:51:52] com.ibm.diagnostics.healthcenter.java FINE: Health Center Agent 4.0.7
06:51:53com.ibm.java.diagnostics.healthcenter.agent.mbean.HCLaunchMBean <init>
INFO: Agent version "3.0.21.202109031203"
06:51:56 com.ibm.java.diagnostics.healthcenter.agent.mbean.HCLaunchMBean startAgent
INFO: Health Center agent running in off mode.
06:51:56 com.ibm.java.diagnostics.healthcenter.agent.mbean.HCLaunchMBean startAgent
INFO: Health Center agent started on port 1972.

and in STDOUT many

com.ibm.lang.management.OperatingSystemMXBean.getTotalPhysicalMemory() 

Using the z/OS DNS on ADCD

This came out of a question. It is another of the little questions that get much bigger.

Background to Domain Name System(DNS)

DNS allows you to get an IP address from a string such as “WWW.MY.COM”.

You can have some files on your local system which provide this mapping, or you can exploit DNS Servers in the big internet.

Some people configure their system so it tries the internet first, and if that fails, uses local files.

You can do reverse DNS lookup, mapping an IP address to a string. For example you want to allow access from sites in WWW.MYFRIEND.COM. When a connection is started, you get the IP address, and can then do a reverse DNS lookup to get a name, which you can check in your “allow” list.

DNS commands for the end user

You can use the “old” tso command NSLOOKUP http://www.ibm.com, or the “new” command dig http://www.ibm.com. Neither of which seemed to give me any output!

The NSLOOKUP and DIG commands send their output to SYSOUT. In my TSO system, SYSOUT has been configured to JES. If I use SDSF, and display the output of my TSO userid, there is a SYSOUT, with the output in it!

NSLOOKUP

The NSLOOKUP command

NSLOOKUP http://www.my.com

NSLOOKUP http://www.my.com this.dns.site

NSLOOKUP 10.1.1.2

Tracing a DNS request

This does not provide much useful information! It does not tell you what happened, or what failed. It is described here.

Starting and stopping the DNS

This is not obvious. At IPL the ADCD.Z24C.PARMLIB(BPXPRM00) member has

RESOLVER_PROC(RESOLVER)

the resolver procedure must be in a data set that is specified by the IEFPDSI DD card specification of the MSTJCLxx PARMLIB member.

If you use D A,L it does not show up.

D A,RESOLVER gives you the normal output.

When I issued

P RESOLVER
S RESOLVER

It used the RESOLVER procedure from USER.Z24C.PROCLIB, the normal concatenation.

Displaying and changing the configuration.

You can display some of the current resolver configuration using

f resolver,display

The output is like

EZZ9298I RESOLVERSETUP - USER.Z24C.TCPPARMS(GBLRESOL)                   
EZZ9298I DEFAULTTCPIPDATA - USER.Z24C.TCPPARMS(GBLTDATA)                
EZZ9298I GLOBALTCPIPDATA - /etc/resolv.conf                             
EZZ9298I DEFAULTIPNODES - ADCD.Z24C.TCPPARMS(ZPDTIPN1)                  
EZZ9298I GLOBALIPNODES - /etc/hosts                                     
EZZ9304I COMMONSEARCH                                                   
EZZ9304I CACHE                                                          
EZZ9298I CACHESIZE - 200M                                               
EZZ9298I MAXTTL - 2147483647                                            
EZZ9298I MAXNEGTTL - 2147483647                                         
EZZ9304I NOCACHEREORDER                                                 
EZZ9298I UNRESPONSIVETHRESHOLD - 25                                     

The only way I could display all of the resolver configuration was to get a resolver trace!

//IBMRESO JOB 1,MSGCLASS=H 
//S1  EXEC PGM=IKJEFT01,REGION=0M 
//SYSPRINT DD SYSOUT=* 
//SYSTSPRT DD SYSOUT=* 
//SYSTCPT DD SYSOUT=* 
//SYSPRINT DD SYSOUT=* 
//SYSTSIN DD * 
NSLOOKUP 99.99.99.99 
/* 

This gave me in //SYSTCPT

Resolver Trace Initialization Complete -> 2023/02/26 18:01:56.725504                      
res_init Parse error on line 1: /etc/resolv.conf

res_init Resolver values:
Setup file warning messages = No
CTRACE TRACERES option = No
Global Tcp/Ip Dataset = /etc/resolv.conf
Default Tcp/Ip Dataset = USER.Z24C.TCPPARMS(GBLTDATA)
Local Tcp/Ip Dataset = None
Translation Table = TCPIP.STANDARD.TCPXLBIN
UserId/JobName = IBMUSER
Caller API = TCP/IP C Sockets
Caller Mode = EBCDIC
System Name = S0W1 (from VMCF)
UnresponsiveThreshold = 25
(D) DataSetPrefix = TCPIP
(D) HostName = S0W1
(D) TcpIpJobName = TCPIP
(*) DomainOrigin = None
(*) NameServer(s) = None
(*) NsPortAddr = 53 (*) ResolverTimeout = 5
(*) ResolveVia = UDP (*) ResolverUdpRetries = 1
(*) Options NDots = 1
(D) Trace Resolver (*) SockNoTestStor
(D) AlwaysWto = NO (D) MessageCase = MIXED
(*) LookUp = DNS LOCAL
(*) Cache
(*) NoCacheReorder
res_init Succeeded
res_init Started: 2023/02/26 18:01:56.794280
res_init Ended: 2023/02/26 18:01:56.794305

This is documented here.

The source of the value is

  • (*) Default value
  • (A) Modified by application
  • (D) Default file (not used if the local file is found)
  • (E) Environment variable
  • (G) Global file
  • (L) Local file

This means the “LookUp = DNS LOCAL ” value came from the default value.

The resolver JCL in USER.Z24C.PROCLIB had

//SETUP DISP=SHR,DSN=USER.Z24C.TCPPARMS(GBLRESOL)

When I changed this member to have LOOKUP LOCAL DSN, and used the F RESOLVER,REFRESH command, this changed the value.

Sample hosts file

The sample host file in TCPIP.SEZAINST(HOSTS) has

; The format of this file is documented in RFC 952, "DoD Internet 
; Host Table Specification". 
; 
; The format for entries is: 
; 
; NET : ADDR : NETNAME : 
; GATEWAY : ADDR, ALT-ADDR : HOSTNM : CPUTYPE : OPSYS : PROTOCOLS : 
; HOST : ADDR, ALT-ADDR : HOSTNM, NICKNM : CPUTYPE : OPSYS : PROTOCOLS : 
; 
; Where: 
;   ADDR, ALT-ADDR = IP address in decimal, e.g., 26.0.0.73 
;   HOSTNM, NICKNM = the fully qualified host name and any nicknames 
;   CPUTYPE = machine type (PDP-11/70, VAX-11/780, IBM-3090, C/30, etc.) 
;   OPSYS = operating system (UNIX, TOPS20, TENEX, VM/SP, etc.) 
;   PROTOCOLS = transport/service (TCP/TELNET,TCP/FTP, etc.) 
;   : (colon) = field delimiter 
;   :: (2 colons) = null field 
; *** CPUTYPE, OPSYS, and PROTOCOLS are optional fields. 
; 
;   MAKESITE does not allow continuation lines, as described in 
;   note 2 of the section "GRAMMATICAL HOST TABLE SPECIFICATION" 
;   in RFC 952.  Entries should be specified on a single line of 
;   up to a maximum of 512 characters per line. 
HOST : 129.34.128.245, 129.34.128.246 : YORKTOWN, WATSON :::: 
; 
NET  : 9.67.43.0 : RALEIGH.IBM.COM : 
; 
GATEWAY : 129.34.0.0 : YORKTOWN-GATEWAY :::: 

Unix application trace

Enable the trace by issuing the Unix command

export RESOLVER_TRACE=~/trace

Run the command

pip install mfpandas      

gave

-[33mWARNING: Retrying (Retry(total=4, connect=None, read=None, redirect=None, status=None)) after connection broken by 'NewConnectionError('<pip._vendor.urllib3.connection.HTTPSConnection object at 0x500B209580>: 
Failed to establish a new connection:
[Errno 1] EDC9501I The name does not resolve for the supplied parameters.')': /simple/mfpandas/-[0m-[33m

Look at the trace file

oedit trace

gave

GetAddrInfo Started: 2025/11/25 15:58:36.890589 
GetAddrinfo Invoked with following inputs:
Host Name: pypi.org
Service Name: 443
Hints parameter supplied with settings:
ai_family = 0, ai_flags = 0x00000000
ai_protocol = 0, ai_socktype = 1
No NameServers specified, no DNS activity
GetAddrInfo Opening Socket for IOCTLs
BPX1SOC: RetVal = 0, RC = 0, Reason = 0x00000000, Type=IPv4
BPX1IOC: RetVal = 0, RC = 0, Reason = 0x00000000
GetAddrInfo Opened Socket 0x00000005
GetAddrInfo Only IPv4 Interfaces Exist
GetAddrInfo Searching Local Tables for IPv6 Address
Global IpNodes Dataset = ADCD.Z31B.TCPPARMS(ZPDTIPN1)
Default IpNodes Dataset = ADCD.Z31B.TCPPARMS(ZPDTIPN1)
Search order = CommonSearch
BPX1ENV Get _BPXK_AUTOCVT: RetVal = 0, RC = 0, Reason = 0x00000000
_BPXK_AUTOCVT current value is ON
BPX1ENV Set _BPXK_AUTOCVT: RetVal = 0, RC = 0, Reason = 0x00000000
_BPXK_AUTOCVT set to OFF
Parse error on line 22: ADCD.Z31B.TCPPARMS(ZPDTIPN1)
SITETABLE from globalipnodes ADCD.Z31B.TCPPARMS(ZPDTIPN1)
- Lookup for pypi.org
GetAddrInfo Searching Local Tables for IPv4 Address
- Lookup for pypi.org
GetAddrInfo Searching Local Tables for IPv6 Address
- Lookup for pypi.org.DAL-EBIS.IHOST.COM
GetAddrInfo Searching Local Tables for IPv4 Address
- Lookup for pypi.org.DAL-EBIS.IHOST.COM
GetAddrInfo Closing IOCTL Socket 0x00000005
BPX1CLO: RetVal = 0, RC = 0, Reason = 0x00000000
GetAddrInfo Failed: RetVal = -1, RC = 1, Reason = 0x78AE1004
GetAddrInfo Ended: 2025/11/25 15:58:36.904995

EDIT       /etc/hosts
Command ===>
****** ******************************************************* Top
==MSG> -Warning- The UNDO command is not available until you chang
==MSG> your edit profile using the command RECOVERY ON.
000001 # BEGIN ANSIBLE MANAGED BLOCK
000002 #72.26.1.2 s0w1.dal-ebis.ihost.com S0W1
000003 127.0.0.1 localhost
000004 # END ANSIBLE MANAGED BLOCK
000005 #IPAddress Hostname alias
000006 151.101.128.223 pypi.org pip
Why can’t I connect to a z/OS port?

I’ve found couple of those little problems which took me a day to resolve – but which are obvious when you understand the problem.

The problems

I was trying to connect the Health Center in Eclipse to the Health agent in Liberty on z/OS.

The first problem was the health center agent on z/OS could not connect to the port. This was due to bad TCPIP configuration

The second problem was I could not connect to it from Eclipse. I had configured the port to be on the local rather than external interface.

My setup

In my jvm.options I had

-Xhealthcenter:level=off,readonly=off,jmx=on,port=1972

Problem 1: The health center agent on z/OS could not connect to the port

In the Liberty startup output I received (after about a timeout of about a minute)

SEVERE: Health Center agent failed to start. java.io.IOException: Cannot bind to URL [rmi://S0W1:1972/jmxrmi]: javax.naming.ServiceUnavailableException [Root exception is java.rmi.ConnectException: Connection refused to host:

Where my system is called S0W1.

It is trying to connect to system S0W1 port 1972, and failing.

TSO PING S0W1 gave

 CS 3.1: Pinging host S0W1.DAL-EBIS.IHOST.COM (172.26.1.2)
Ping #1 timed out

This was a surprise to me – I was expecting it to be my local z/OS machine…. I do not have an interface with address 172.26.1.2. This explains why it timed out.

In my ADCD.Z31B.TCPPARMS(GBLTDATA) I had

S0W1:   HOSTNAME   S0W1 
;
;
; NOTE - Use either DOMAINORIGIN/DOMAIN or SEARCH to specify your domain
; origin value
;
; DOMAINORIGIN or DOMAIN statement
; ================================
; DOMAINORIGIN or DOMAIN specifies the domain origin that will be
; appended to host names passed to the resolver. If a host name
; ends with a dot, then the domain origin will not be appended to the
; host name.
;
DOMAINORIGIN DAL-EBIS.IHOST.COM

Because S0W1 did not end with a dot – TCPIP put the DOMAINORIGIN on the end.

ADCD.Z31B.TCPPARMS(ZPDTIPN1)

had

172.26.1.2 S0W1.DAL-EBIS.IHOST.COM S0W1      
127.0.0.1 LOCALHOST

Which says for S0W1…. use IP address 172.26.1.2.

I changed this to

S0W1:   HOSTNAME   S0W1.
   127.0.0.1       S0W1        
127.0.0.1 LOCALHOST

With these changes, I restarted TCPIP, and told the resolver to use the updated configuration.

F RESOLVER,REFRESH,SETUP=ADCD.Z31b.TCPPARMS(GBLRESOL)

I then got

INFO: Health Center agent started on port 1972.

So my first success. However…

Problem 2 : I could not connect Eclipse to the port

… once I had managed to get get the server to connect to the port. When the server issues a TCPIP binds to a port, you need to specify the IP address and port. I had configured the hostname S0W1 as the local interface (127.0.0.1). When I tried to connect from Eclipse, I was trying to connect to port 1972 on interface 10.1.1.2 – which had not been configured!

The Liberty output had

WARNING: RMI TCP Accept-1972: accept loop for erverSocket[addr=0.0.0.0/0.0.0.0, localport=1972] throws java.io.IOException: EDC5122I Input/output error. (errno2=0x12B804B9)

I changed ADCD.Z31B.TCPPARMS(ZPDTIPN1) to have

10.1.1.2 S0W1
127.0.0.1 LOCALHOST

so the name S0W1 is associated with interface 10.1.1.2. I started restart TCPIP and the resolver and it manage to connect. It only took a day to resolve these problems.