The title When tracing a job it helps to trace the correct address space is a clue – it looks obvious, but the problem was actually subtle.
The scenario
I was testing the new version of Zowe, and one of the components failed to start because it could not find a keyring. Other components could find it ok. I did a RACF trace and there were no records. The question is why were there no records?
The execution environment.
I start Zowe with S ZOWE33. This spawns some processes such as ZOWE335. This runs a Bash script which starts a Java program.
I start a GTF trace with
s gtf.gtf,m=gtfracf
#set trace(callable(type(41)),jobname(Zowe*))
Where callable type 41 is for r_datalib services to access a keyring.
No records were produced
What is the problem? Have a few minute pause to think about it.
Solution
After 3 days I stumbled on the solution – having noticed, but ignored the evidence. I wondered if the Java code to process keyrings, did not use the R_datalib API, I wondered if Java 21 uses a different jar file for processing keyrings – yes – but this didn’t solve the problem.
The solution was I should have been tracing job ZWE33CS! Whoa – where did that come from?
When a new z/OS® UNIX process is started, it runs in a z/OS UNIX initiator (a BPXAS address space). By default, this address space has an assigned job name of userIDx, where userID is the user ID that started the process, and x is a decimal number. You can use the _BPX_JOBNAME environment variable to set the job name of the new process. Assigning a unique job name to each … process helps to identify the purpose of the process and makes it easier to group processes into a WLM service class.
If I use the command D A,L it lists all of the address spaces running on the system. I had seen the ZOWE33* ones, and also the ZWE* ones – but ignored the ZWE* ones. Once I knew the solution is was so obvious.
The Java Health centre has an agent running in the JVM of interest, and there is Eclipse plug-in to display the data.
A Java server such as Liberty ( as used in z/OSMF, z/OSMF and MQWEB) can provide information on how the server is running. I was running MQWEB with Openj9, Java 21 (Semeru).
You need to configure the Liberty server and have something to process the data such as Health Center running on Eclipse.
You can display information in graphical time line format, such as
CPU used, system and application as used by the JVM
Which classes are being used
The environment – such as the parameters used to start the JVM
Garbage collection activity
I/O – number of files open, and open activity
Method profiling
Threads in use.
Configure the Eclipse
I installed Health Center from the Market place.
How to collect the data
You can configure the JVM in different modes:
headless – data is collected and written to the local file system
collect from the start – and view in Eclipse, this means you get all of the Java class loading activity
start collecting only after Eclipse has started, and connected to the JVM. I use this method. I start my server, and run a workload to “warm up the JVM” then use Eclipse to show the activity due to my testing.
Note the jmx=on and the port number. You need this for the Eclipse configuration. The level=off means do not start collecting data until the Health centre agent connects.
In Eclipse
File -> New Connection… -> Enable an application for monitoring -> Next.
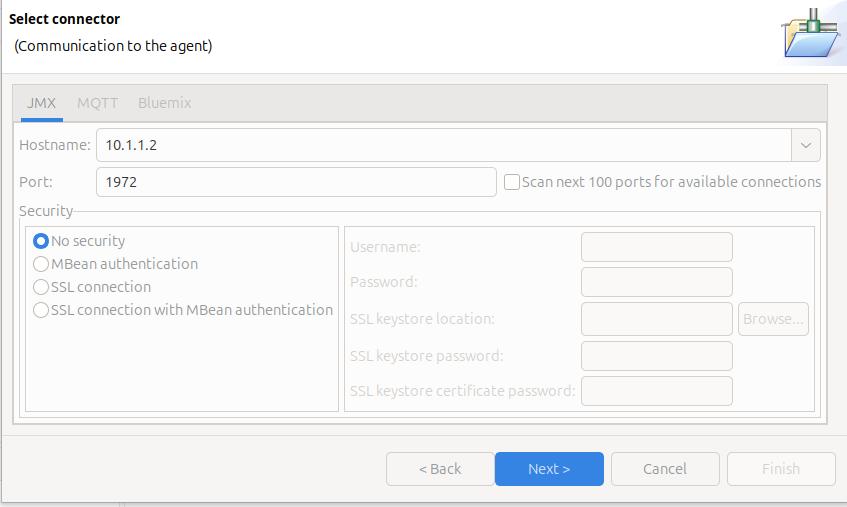
On the Select connector panel I used
Once it worked, I enabled security.
Click Next
The Health Centre then starts searching at the specified port. I disable the Scan next 100 ports… When it manages to connect to the port, click Finish.
It takes a few seconds to start the data collection, and start downloading the data.
Let the JVM warm up
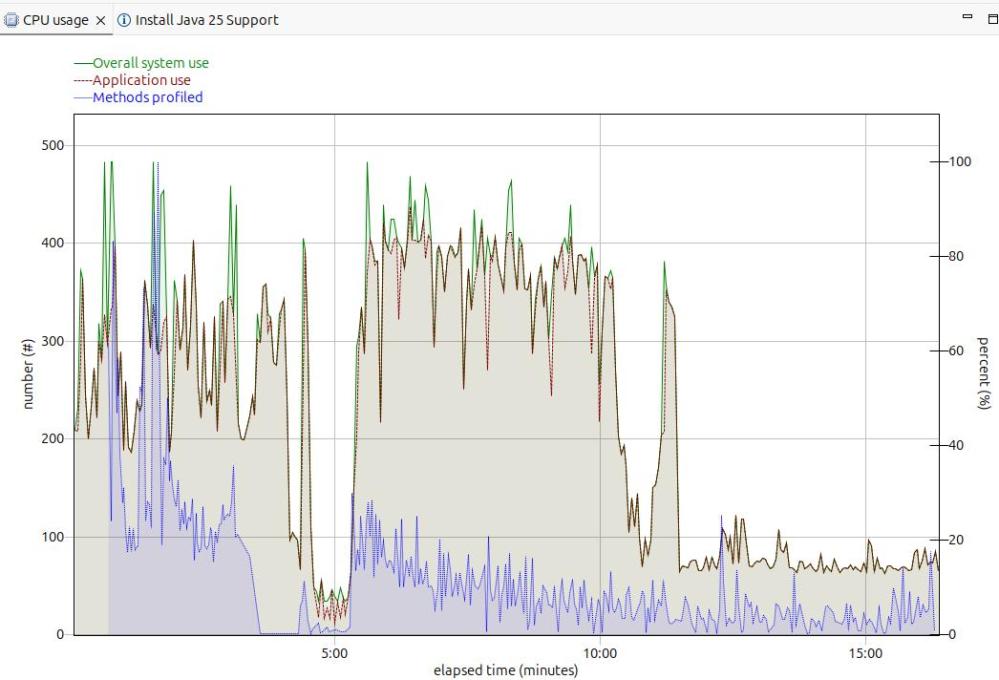
The image below shows the CPU usage from the start of the server.
For the first 5 minutes, this is the JVM starting up with no workload. Afterwards the CPU used drops to a low value.
After 5 minutes, I started my workload. For the first 12 or so minutes the CPU is high, but after about 13 minutes it levels out. If you want to do any measurements of cost per transaction you should take them from this period. During the “warm up” period, the JVM is optimising the code etc.
The green line shows the system CPU usage. The red line (and grey area) shows the Application usage. We can see most of the CPU used is application usage.
The number of methods profiled is the JVM optimising the code. It takes the “hottest” classes and does those first… until all (most) of the classes are optimised.
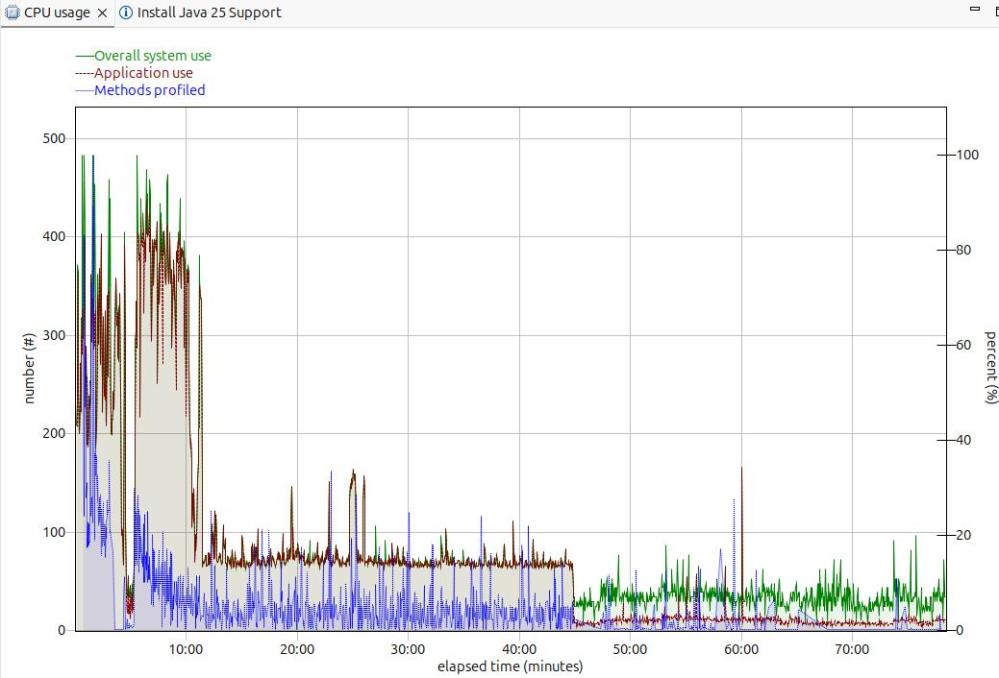
Long term monitoring.
f
From this diagram you can see the JVM startup, the initial part of my test where the JVM was warming up, the remainder of the test, and the JVM overhead after the test.
You need to take all of these into consideration when running performance tests.
Running performance tests
I set up my Work Load Manager configuration to record the number of MQ transactions, and had a report class for the MQWEB server. From this I can calculate the cost per transaction.
[06:51:52] com.ibm.diagnostics.healthcenter.Agent FINE: System receiver, version 1.0
[06:51:52] com.ibm.diagnostics.healthcenter.Agent FINE: /usr/lpp/java/J21.0_64//lib/libhcapiplugin.so, version 1.0
[06:51:52] com.ibm.diagnostics.healthcenter.java FINE: Health Center Agent 4.0.7
06:51:53com.ibm.java.diagnostics.healthcenter.agent.mbean.HCLaunchMBean <init>
INFO: Agent version "3.0.21.202109031203"
06:51:56 com.ibm.java.diagnostics.healthcenter.agent.mbean.HCLaunchMBean startAgent
INFO: Health Center agent running in off mode.
06:51:56 com.ibm.java.diagnostics.healthcenter.agent.mbean.HCLaunchMBean startAgent
INFO: Health Center agent started on port 1972.
As part of my configuring Zowe, and using Java shared classes, I’ve needed to change the Java parameters in Zowe. I know there is a plan to provide this support – but this is what I’ve done.
Find the start up script.
If you use the Unix command
find zowe/components -name startup.sh
This will list the scripts for the components.
I edited zowe/components/gateway/bin/start.sh and inserted at the top
 COL="/u/tmp/zowec/"

 TAG="GW"
 fn="${COL}/java.options.${TAG}"
 if [ -f "${fn}" ]; then
  set -x
   export
   exec 1>>${COL}start.log1${TAG} 2>>${COL}start.log2${TAG}
   COLIN="-Xoptionsfile=${fn} -XshowSettings "
 else
  COLIN=""
 fi
With Java shared classes cache, by default on z/OS saves the data in shared memory. You can use the snapshot command to save a copy on disk, and use the restore command after IPL to recreate it. For my zPDT system running z/OS on a Linux server this many seconds of start up time.
In more recent Java versions, the Shared Classes Cache has supported the persistent option, where shared virtual storage is mapped to a file – and so updating memory, updates the file.
I had a few problems getting this to work, and there was no documentation on the use of the persistent option.
JVMJ9VM015W Initialization error for library j9shr29(11): JVMJ9VM009E J9VMDllMain failed
JVMSHRC245E Error mapping shared class cache file
JVMSHRC336E Port layer error code = -155
JVMSHRC337E Platform error message: EDC5132I Not enough memory.
JVMSHRC840E Failed to start up the shared cache.
JVMJ9VM015W Initialization error for library j9shr29(11): JVMJ9VM009E J9VMDllMain failed
Error: Could not create the Java Virtual Machine.
Error: A fatal exception has occurred. Program will exit.
I had to change the SMFLIMxx parmlib member to fix this.
Display the current SMFLIM configuration
You can display your current SMFLIMxx configuration using
d smflim
d smflim,r
The d smflim,r gave me
...
Member and rule number SMFLIMCP 0003
User:
 ZWESVUSR
Attributes:
 EXECUTE: NOCHANGE
 JOBMSG: ISSUE
 MAXSHARE: 9000000
...
Which shows the rule for user ZWEVSUR came from the third rule in SMFLIMCP. It sets MAXSHARE, and other parameters.
Update the member
I updated my SMFLIMCP member to be
REGION USER(COLIN) JOBMSG(ISSUE) MAXSHARE(90000)
activated it using t SMFLIM=(CP,C2) where CP2,C2 is my list of SMFLIM members. Note: The T SMFLIM command, replaces all of the definitions with what is in the list, so you need to specify the whole list, not just the changed member.
The definitions become active immediately, you do not need to logoff and logon, or resubmit a job.
When the Java job had started, it created a file C290M21F1A64P_hw_G43L00 in the specified directory.
When persistent was not specified, files were stored in the javasharedresources subdirectory.
Should I use this persistent option?
You have the choice of using the persistent option in the -Xshareclasses…persistent parameters, or not to specify it. If you do not use the persistent option you need to save the shared memory across IPLs, by using -Xshareclasses:…,snapshotCache and restoring it after an IPL using -Xshareclasses:…restoreFromSnapshot. I used this method, and added a steps to my started tasks, one to restore (if the cache exists already, it does nothing), and one at the end, to save it.
How does the performance compare?
On my zPDT system which is not meant to be used for performance evaluations, they both had similar durations, and used similar amounts of CPU, though non persistent was usually slight better.
Funny…
I also go message
JVMSHRC561E Failed to initialize the shared classes cache, there is not enough space in the file system. Available free disk space bytes = 516144128, requested bytes = 536870912.
Which was a surprise as I thought I had enough free disk space.
You can start a Java program by specifying the class name and the class path to use (containing .class and/or .jar files), or you can specify just a self contained .jar file, which contains all it needs. I wont describe Java Modules ( Java Platform Module System, .jmod -> stronger encapsulation, improved dependency management, better code organization, enhanced security, streamlined JRE, and potentially faster application startup times), or a Java Run Time image (.jrt, which includes only the necessary modules required for a specific application, making it smaller, safer, and capable of starting faster than a full JRE).
Create class files
The documentation for Java says you have to create a manifest so Java knows which classes to use.
I have a simple program hw.java
class HelloWorld {
    public static void main(String[] args) {
        System.out.println("Hello, World!");
    }
}
I compiled it with
/usr/lpp/java/J21.0_64/bin/javac hw.java
This creates .class files for each class in the original source.
HelloWorld.class
It will start the function “main” within the class.
Create a jar file and specify the entry point
Java needs to know the entry point class of the jar file. The code below creates the jar file, specifying the entry point class name ( -e ..) and includes all of the classes specified (just HelloWorld.class).
Under the covers it creates a manifest file META-INF/MANIFEST.MF . It is not in the default code page, so to look at it, I expanded the jar file, used oedit META-INF/. , then used the line command ea to edit it in ASCII.
Java needs to know the entry point class name of the jar file. You can specify it in the manifest. The code below creates the jar file, using the specified manifest file, and includes all of the classes specified (just HelloWorld.class). The manifest is the one in the previous section.
I was looking at some Jar files, and the manifest does not have a Main-Class entry, and there is no entry point specify on the java command – so there is clearly another way of specifying the entry point.
I was trying to understand a class load problem, and needed to use Java internal virtual machine trace to see what was happening.
You specify -Xtrace options at start up. Even with limiting options, I had over 2 millions lines of trace output – and the Java application had not fully started!
To get all of the parameters in a trace, you need to specify -Xtrace:maximal=..
To get the trace points, and not all of the parameters you need to specify -Xtrace:minimal=…
j9prt is VM port libraries… the platform specific (ported) code
omrport is the OMR ported code. (OMR is a set of common components, such as threads and garbage collection)
I haven’t used it,but you can say do something when this trace point is triggered, stop (suspend) tracing.
-Xtrace:trigger=tpnid{abc.123,suspend}
In the example trace output
07:49:24.699384689 0x000000002167f200 omrport.657 Event J9 VM NLS message: Failed to find class org/springframework/boot/loader/launch/PropertiesLauncher in shared cache for class-loader id 0.
where the trace point is omrport.657
You can put the definitions in a file -Xtrace:properties=<filename>
I have a trace file – now what?
You can format the trace file on z/OS, but I downloaded the file (in binary) to my Linux machine, because a) I have more disk space, 2) the java formatting is faster, 3) I have better tools to look at the data. You need the save level of Java (or better) to format all the fields. If there is a mismatch, some fields will not be formatted. The traceformat command is described here.
-indent: Indents trace messages at each Entry trace point and outdents trace messages at each Exit trace point. The default is not to indent the messages.
-threads: Filters the output for the given thread IDs only. thread id is the ID of the thread, which can be specified in decimal or hex (0x) format. Any number of thread IDs can be specified, separated by commas.
Looking at the data
I used the commands grep -n …., tail -n +999, head -n 500, less as described here. But for detailed analysis I piped the output into a file, and used an editor on the output. This meant the lines did not wrap, I could annotate (and save) the trace, and highlight interesting records.
Because some of the lines are very long, I split interesting lines so all of the data was displayed in the window, and I did not need to scroll.
Even though I built the jar file and updated the Java build class path, it could not find the package, getting message “The package com.ibm.oti.shared is not available”.
I found
I had to add the .jmod file to the “module” part of the build class path, and not the classpath itself.
I had a jar with the same name in the Eclipse application tree.
Which defines which symlinks to define for the javac, java and jar commands.
You also need to update your Java_Home environment variable.
There’s more
I had to configure Eclipse to use this new level of Java. Window-> Preferences-> Installed JREs, and use the location of the directory /home/colinpaice/Downloads/jdk-21.0.6+7.
On z/OS the Java shared classes use shared storage. Data is added to the shared classes as the application process classes, so successive Java applications can use this shared data.
You can harden this to disk, so it is available across an IPL, using the snapshotCache command.
When restoring the snapshot, you need to be careful to get the file/semaphore/shared memory owner and permissions correct. I found the easiest way is to the the started procedure which runs the Java application to always do a restoreSnapshotCache. It is very easy to get the permissions wrong, and Java will not start.
Restoring from an “normal” userid with no authority
/usr/lpp/java/J17.0_64/bin/java -Xshareclasses:cacheDir=/u/tmp/zowec,name=zoweGW,restoreFromSnapshot JVMSHRC721E The JVM is not configured to access the non-persistent shared cache snapshot file “/u/tmp/zowec/javasharedresources/C290M17F1A64S_zoweGW_G43L00”. To open the file, use ‘groupAccess’ sub-option. JVMSHRC699E Failed to restore the non-persistent shared cache “zoweGW” from the snapshot
Using an “normal” userid and groupAccess gave
/usr/lpp/java/J17.0_64/bin/java -Xshareclasses:cacheDir=/u/tmp/zowec,name=zoweGW,restoreFromSnapshot,groupAccess JVMSHRC020E An error has occurred while opening semaphore JVMSHRC336E Port layer error code = -197360 JVMSHRC337E Platform error message: semget : EDC5129I No such file or directory. JVMSHRC727E An error has occurred in creating the new non-persistent shared cache JVMSHRC808I Compressed references shared cache “zoweGW” is destroyed. Use option -Xnocompressedrefs if you want to destroy a non-com pressed references cache. JVMSHRC699E Failed to restore the non-persistent shared cache “zoweGW” from the snapshot
Using a userid with su (id = 0) userid, also failed to work for the same reasons
The userid ZWESVUSR is a nolog userid, so you cannot logon to TSO with it.
Become the cache owner
A superuser can issue
su ZWESVUSR
Then issue the restoreFromSnapshot command, and remember to issue “exit” to get out of su mode.
Do it as part of your application startup
I have a started task with userid ZWESVUSR and issue restoreFromSnapshot command from BPXBATCH. It could be the first step of your Java application startup.
When your Java application ends it prints information like
JVMSHRC168I Total shared class bytes read=78435794. Total bytes stored=522418 JVMSHRC818I Total unstored bytes due to the setting of shared cache soft max is 0. Unstored AOT bytes due to the setting of -Xscmaxaot is o. Unstored JIT bytes due to the setting of -Xscmaxjitdata is 0.
Found class java/lang/Object in shared cache for class-loader id 0.
Found class java/lang/J9VMInternals in shared cache for class-loader id 0.
Entries which were not found…but added.
The following shows that the entry was not found in the share classes cache, but was added successfully. Next time this would give ” found and used” above.
Failed to find class java/security/Guard in shared cache for class-loader id 0.
Stored class java/security/Guard in shared cache for class-loader id 0 with
URL /Z31B/usr/lpp/java/J8.0_64/J21.0_64/lib/modules (index 0).
What classes were not found and not added?
Failed to find class org/yaml/snakeyaml/constructor/Construct in shared cache for class-loader id 0.
Failed to find class org/yaml/snakeyaml/constructor/Construct in shared cache for class-loader id 2.
When Java option -verbose:class was enabled, there was additional information
class load: org.yaml.snakeyaml.constructor.Construct from:
jar:nested:/u/tmp/zowep/components/gateway/bin/gateway-service.jar/!BOOT-INF/lib/snakeyaml-2.2.jar!/
The jar:nested means it is a jar within a bigger jar. The shared class support does not support this.
To exploit the shared classes function it seems to be better to have individual .jar files rather than one large jar file with lots of jar files within it.
The loader id 2 is from the spring framework loaded. This loads the nested jar files.
What classes were loaded from where?
With the Java option -verbose:class (not a shared classes cache option) this reports on classes used.
 class load: java/net/URLClassLoader$SharedClassMetaDataCache from: jrt:/java.base
 class load: java/net/URLClassLoader$SharedClassMetaData from: jrt:/java.base
cache layer = 0 cache size = 83885520 softmx bytes = 83885520 free bytes = 31274608 Reserved space for AOT bytes = -1 Maximum space for AOT bytes = -1 Reserved space for JIT data bytes = -1 Maximum space for JIT data bytes = 31457280 Metadata bytes = 752058 Metadata % used = 1% Class debug area size = 6680576 Class debug area used bytes = 5576890 Class debug area % used = 83%
ROMClass bytes = 35210448 AOT bytes = 8456750 JIT data bytes = 1150472 Zip cache bytes = 0 Startup hint bytes = 240 Data bytes = 360368