The Java Health centre has an agent running in the JVM of interest, and there is Eclipse plug-in to display the data.
A Java server such as Liberty ( as used in z/OSMF, z/OSMF and MQWEB) can provide information on how the server is running. I was running MQWEB with Openj9, Java 21 (Semeru).
You need to configure the Liberty server and have something to process the data such as Health Center running on Eclipse.
You can display information in graphical time line format, such as
- CPU used, system and application as used by the JVM
- Which classes are being used
- The environment – such as the parameters used to start the JVM
- Garbage collection activity
- I/O – number of files open, and open activity
- Method profiling
- Threads in use.
Configure the Eclipse
I installed Health Center from the Market place.
How to collect the data
You can configure the JVM in different modes:
- headless – data is collected and written to the local file system
- collect from the start – and view in Eclipse, this means you get all of the Java class loading activity
- start collecting only after Eclipse has started, and connected to the JVM. I use this method. I start my server, and run a workload to “warm up the JVM” then use Eclipse to show the activity due to my testing.
Configure the JVM server
The options are listed here.
You can specify the JVM options on the command line or the jvm.options file.
You can specify them on the -Xhealthcenter:… statement, or as
-Dcom.ibm.diagnostics.healthcenter...=...
values. For example
-Xhealthcenter:level=off,readonly=off,jmx=on,port=1972
or
-Xhealthcenter:level=off
-Dcom.ibm.java.diagnostics.healthcenter.agent.port=1972
-Dcom.ibm.diagnostics.healthcenter.jmx=on
-Dcom.ibm.diagnostics.healthcenter.readonly=on
To run headless
In the server
I added the following to my jvm.options
-Xhealthcenter:level=headless
-Dcom.ibm.java.diagnostics.healthcenter.headless.delay.start=2
-Dcom.ibm.diagnostics.healthcenter.headless=on
-Dcom.ibm.java.diagnostics.healthcenter.data.collection.level=headless
-Dcom.ibm.java.diagnostics.healthcenter.headless.output.directory=/u/tmp/zowec/
-Dcom.ibm.diagnostics.healthcenter.readonly=on
Down load the files to your work station, and use File -> Load Data to process the files.
To run the Health centre in real time
In the server
-Xhealthcenter:level=off,readonly=off,jmx=on,port=1972
-Dcom.ibm.diagnostics.healthcenter.logging.level=debug
Note the jmx=on and the port number. You need this for the Eclipse configuration. The level=off means do not start collecting data until the Health centre agent connects.
In Eclipse
File -> New Connection… -> Enable an application for monitoring -> Next.
On the Select connector panel I used
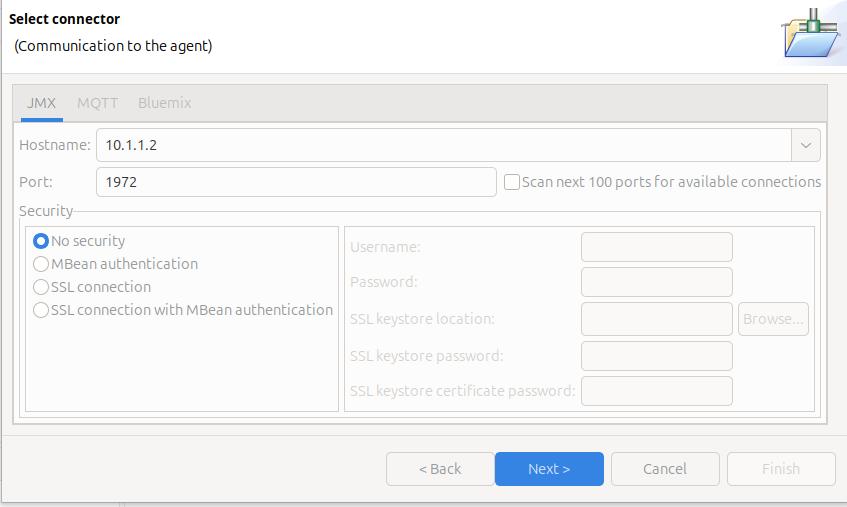
Once it worked, I enabled security.
Click Next

The Health Centre then starts searching at the specified port. I disable the Scan next 100 ports… When it manages to connect to the port, click Finish.
I initially had problems connecting to the server, see Why can’t I connect to a z/OS port?
It takes a few seconds to start the data collection, and start downloading the data.
Let the JVM warm up
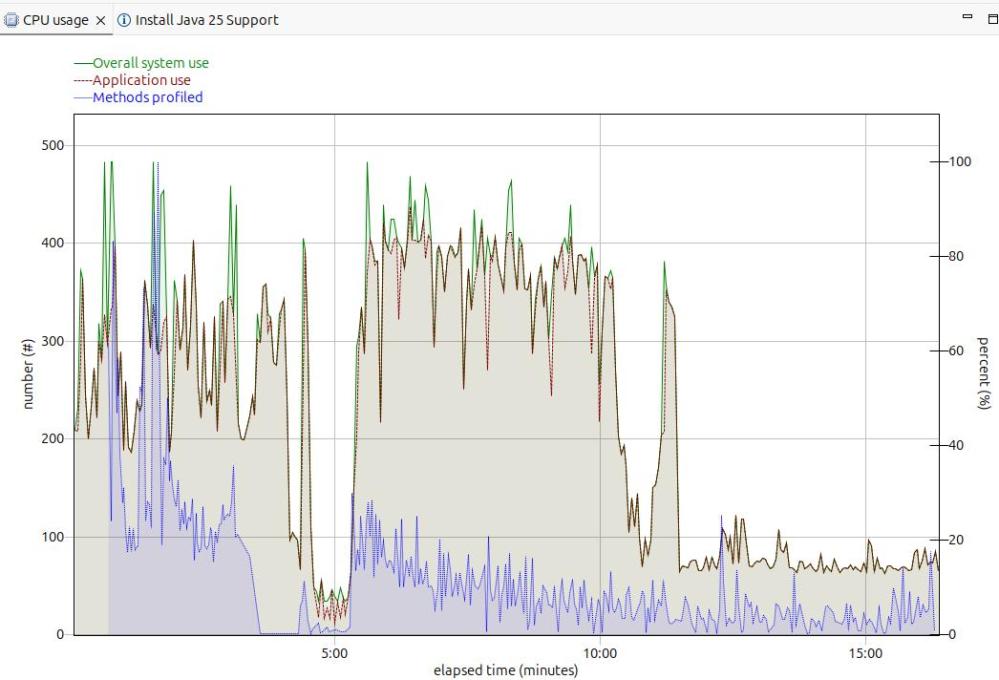
The image below shows the CPU usage from the start of the server.
For the first 5 minutes, this is the JVM starting up with no workload. Afterwards the CPU used drops to a low value.
After 5 minutes, I started my workload. For the first 12 or so minutes the CPU is high, but after about 13 minutes it levels out. If you want to do any measurements of cost per transaction you should take them from this period. During the “warm up” period, the JVM is optimising the code etc.
The green line shows the system CPU usage. The red line (and grey area) shows the Application usage. We can see most of the CPU used is application usage.
The number of methods profiled is the JVM optimising the code. It takes the “hottest” classes and does those first… until all (most) of the classes are optimised.
Long term monitoring.
f
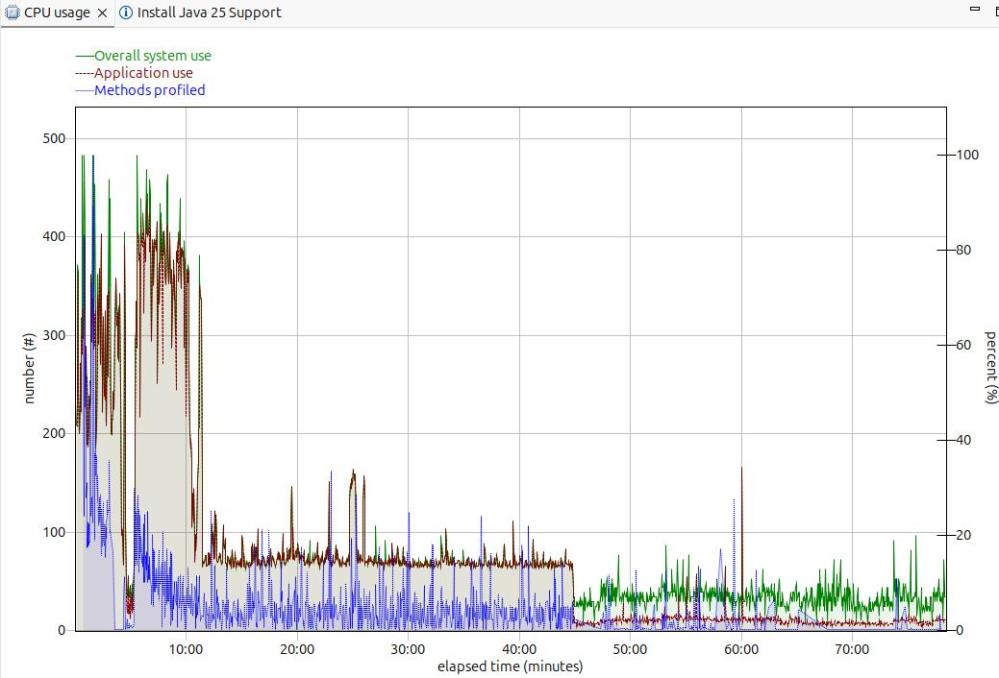
From this diagram you can see the JVM startup, the initial part of my test where the JVM was warming up, the remainder of the test, and the JVM overhead after the test.
You need to take all of these into consideration when running performance tests.
Running performance tests
I set up my Work Load Manager configuration to record the number of MQ transactions, and had a report class for the MQWEB server. From this I can calculate the cost per transaction.
Health centre agent logging
With
-Dcom.ibm.diagnostics.healthcenter.logging.level=finest
I had output in the STDERR output
[06:51:52] com.ibm.diagnostics.healthcenter.Agent FINE: System receiver, version 1.0
[06:51:52] com.ibm.diagnostics.healthcenter.Agent FINE: /usr/lpp/java/J21.0_64//lib/libhcapiplugin.so, version 1.0
[06:51:52] com.ibm.diagnostics.healthcenter.java FINE: Health Center Agent 4.0.7
06:51:53com.ibm.java.diagnostics.healthcenter.agent.mbean.HCLaunchMBean <init>
INFO: Agent version "3.0.21.202109031203"
06:51:56 com.ibm.java.diagnostics.healthcenter.agent.mbean.HCLaunchMBean startAgent
INFO: Health Center agent running in off mode.
06:51:56 com.ibm.java.diagnostics.healthcenter.agent.mbean.HCLaunchMBean startAgent
INFO: Health Center agent started on port 1972.
and in STDOUT many
com.ibm.lang.management.OperatingSystemMXBean.getTotalPhysicalMemory()

