Performance: My works run slower on pre-production than in test – why?

I was at the 2025 GSUK, and someone asked me this (amongst other questions). I had a think about it and came up with….

The unhelpful answer

Well it is obvious; what did you expect?

A better answer.

There are many reasons…. and some are not obvious.

General performance concepts

  • A piece of work is either using CPU or waiting.

CPU

  • Work can use CPU
  • A transaction may be delayed from starting. For example WLM says other work is more important that yours.
  • Once your transaction has started, and has issued a requests, such as an I/O request. When the request has finished – your task may not be re-dispatched immediately because other work has a higher priority – other work is dispatched to keep to the WLM system goals.

I remember going to a presentation about WLM when it was first available. Customers were “complaining” because batch work was going through faster when WLM was enabled. CICS transactions used to complete in half a second, but the requirement was 1 second. The transactions now take 1 second (no one noticed) – and batch is doing more work.

Your transaction may be doing more work.

For example in Pre Production, you only read one record from the (small) database. The Production database may be much larger, and the data is not in memory. This means it takes longer to get a record. In production, you may have to process more records – which adds to the amount of work done.

Your database may not be optimally configured. In one customer incident, a table was (mis) configured so it did a sequential scan of up to 100 records to find the required record. In production there were 1000’s of records to scan to find the required record; increasing the processing time by a factor of 10. They defined an index and cured the problem. The problem only showed up in production.

Waiting

There are many reason for an application to wait. For example

For CPU

See above.

Latches

A latch is a serialisation mechanism for very short duration activities (microseconds). For example if a thread wants to GETMAIN a block of storage, the system gets the address space latch (lock), updates the few storage pointers, and releases the latch. The more thread running in the address space, and the more storage requests they issue the more chance of two threads trying to get the latch at the same time and so tasks may have to wait. At the deep hardware level the storage may have to be accessed from different CPUs… and so data moves 1 meter or so, and so this is a slow access.

Application IO

An application can read/write a record from a data set, a file, or the spool. There may be serialisation to the resource to ensure only one thread can use the record.

Also if there are a limited number of connections from the processor to the disk controller, higher priority work may be scheduled before your work.

Database logging delays

If your application is using DB2, IMS, or MQ, these subsystems process requests from many address spaces and multiple threads.

As part of transactional work, data is written to the log buffers.

At commit time, the data for the thread is written out to disk. Once the data is written successfully the commit can return.

There are several situations.

  • If the data has already been written – do not wait; just return “OK”
  • There is no log I/O active in the subsystem. Start the I/O and wait for completion. The duration is one I/O.
  • There is currently an I/O in progress. Keep writing data to a buffer. When the I/O completes, start the next I/O with data from the buffer. On average your task waits half an I/O time while the previous I/O completes, then the I/O time. The duration (on average) is 1.5 I/O time
  • As the system gets busier more data is written in each I/O. This means each I/O takes longer – and the previous wait takes longer.
  • There is so much data in the log buffer, that several log writes are needed before the last of your data is successfully written. The duration is multiple long I/O rquests.

This means that other jobs running on the system, using the same DB2, IMS or MQ will impact the time to write the data to the subsystem log, and so impact your job.

Database record delays

If you have two threads wanting to update the same database record, then there will be a data lock from the time gets the record for update, to the end of the commit time. Another task wanting that record will have to wait for the first task to finish. Of course on a busy system, the commits will take longer, as described above.

What can make it worse is when a transactions gets a record for update (so locking it) and then issues a remote request, for example over TCPIP, to another server. The record lock is held for the duration of this request, and the commit etc. The time depends on the network and back end system.

Network traffic

If your transaction is using remote servers, this can take a significant time

  • Establishing a connection to the remote server.
  • Establishing the TLS session. This can take 3 flows to establish a secure session.
  • Transferring the data. This may involve several blocks of data sent, and several blocks received.
  • Big blocks of data can take longer to process. You can configure the network to use big buffers.
  • The network traffic depends on all users of the network, so you may have production data going to the remote site. On the Pre Production you may have a local, closer, server.

Waiting for the human input.

For example prompting for account number and name.

Yes, but the pre-production is not busy!

This is where you have to step back and look at the bigger picture.

Typically the physical CPU is partitioned into many LPARS. You may have 2 production LPARS, and one pre-production LPARs.
The box has been configured so that production gets priority over Pre Production.

CPU

Although your work is top of the queue for execution on your LPAR , the LPAR is not given any CPU because the production LPARs have priority. When the production LPARs do not need CPU, the Pre Production gets to use the CPU and your work runs (or not depending on other work)

IO

There may be no other task on your LPAR using the device, so there is no delays in the LPAR issuing the I/O request to the disk controller. However other work may be running on other LPARs, and so there is contention from the storage controller down to the storage.

Overall

So not such an obvious answer after all!

Please give a rating.

Go back

Your message has been sent

Please give rating for the blog post(optional – no logon required)
Warning

Using the Java Health centre for looking into Z/OSMF, MQWEB and other Liberty products.

The Java Health centre has an agent running in the JVM of interest, and there is Eclipse plug-in to display the data.

A Java server such as Liberty ( as used in z/OSMF, z/OSMF and MQWEB) can provide information on how the server is running. I was running MQWEB with Openj9, Java 21 (Semeru).

You need to configure the Liberty server and have something to process the data such as Health Center running on Eclipse.

You can display information in graphical time line format, such as

  • CPU used, system and application as used by the JVM
  • Which classes are being used
  • The environment – such as the parameters used to start the JVM
  • Garbage collection activity
  • I/O – number of files open, and open activity
  • Method profiling
  • Threads in use.

Configure the Eclipse

I installed Health Center from the Market place.

How to collect the data

You can configure the JVM in different modes:

  • headless – data is collected and written to the local file system
  • collect from the start – and view in Eclipse, this means you get all of the Java class loading activity
  • start collecting only after Eclipse has started, and connected to the JVM. I use this method. I start my server, and run a workload to “warm up the JVM” then use Eclipse to show the activity due to my testing.

Configure the JVM server

The options are listed here.

You can specify the JVM options on the command line or the jvm.options file.

You can specify them on the -Xhealthcenter:… statement, or as

-Dcom.ibm.diagnostics.healthcenter...=... 

values. For example

-Xhealthcenter:level=off,readonly=off,jmx=on,port=1972 

or

-Xhealthcenter:level=off
-Dcom.ibm.java.diagnostics.healthcenter.agent.port=1972
-Dcom.ibm.diagnostics.healthcenter.jmx=on
-Dcom.ibm.diagnostics.healthcenter.readonly=on

To run headless

In the server

I added the following to my jvm.options

-Xhealthcenter:level=headless 
-Dcom.ibm.java.diagnostics.healthcenter.headless.delay.start=2
-Dcom.ibm.diagnostics.healthcenter.headless=on
-Dcom.ibm.java.diagnostics.healthcenter.data.collection.level=headless
-Dcom.ibm.java.diagnostics.healthcenter.headless.output.directory=/u/tmp/zowec/
-Dcom.ibm.diagnostics.healthcenter.readonly=on

Down load the files to your work station, and use File -> Load Data to process the files.

To run the Health centre in real time

In the server

-Xhealthcenter:level=off,readonly=off,jmx=on,port=1972 
-Dcom.ibm.diagnostics.healthcenter.logging.level=debug

Note the jmx=on and the port number. You need this for the Eclipse configuration. The level=off means do not start collecting data until the Health centre agent connects.

In Eclipse

File -> New Connection… -> Enable an application for monitoring -> Next.

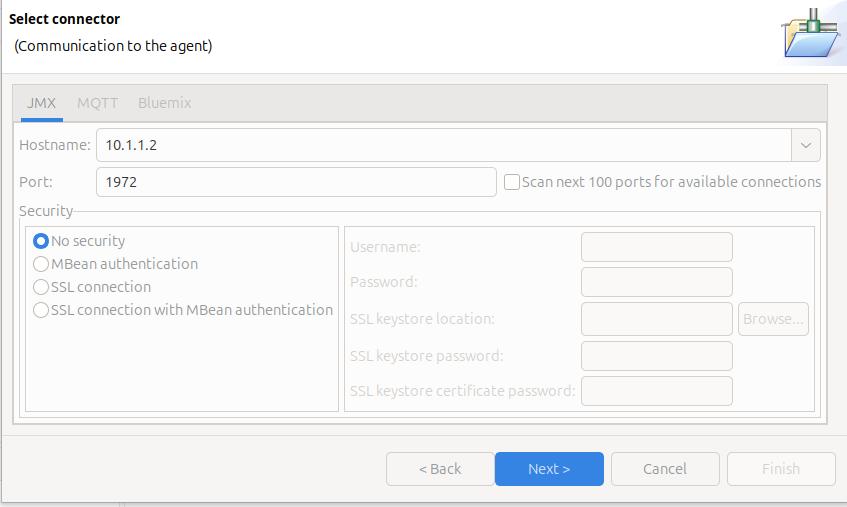
On the Select connector panel I used

Once it worked, I enabled security.

Click Next

The Health Centre then starts searching at the specified port. I disable the Scan next 100 ports… When it manages to connect to the port, click Finish.

I initially had problems connecting to the server, see Why can’t I connect to a z/OS port?

It takes a few seconds to start the data collection, and start downloading the data.

Let the JVM warm up

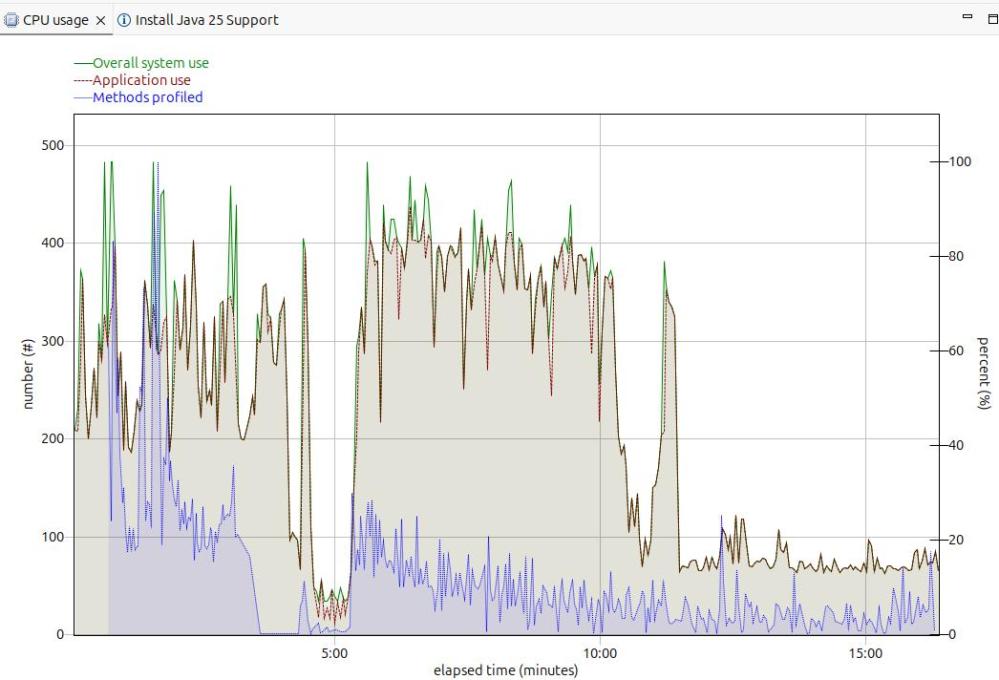
The image below shows the CPU usage from the start of the server.

For the first 5 minutes, this is the JVM starting up with no workload. Afterwards the CPU used drops to a low value.

After 5 minutes, I started my workload. For the first 12 or so minutes the CPU is high, but after about 13 minutes it levels out. If you want to do any measurements of cost per transaction you should take them from this period. During the “warm up” period, the JVM is optimising the code etc.

The green line shows the system CPU usage. The red line (and grey area) shows the Application usage. We can see most of the CPU used is application usage.

The number of methods profiled is the JVM optimising the code. It takes the “hottest” classes and does those first… until all (most) of the classes are optimised.

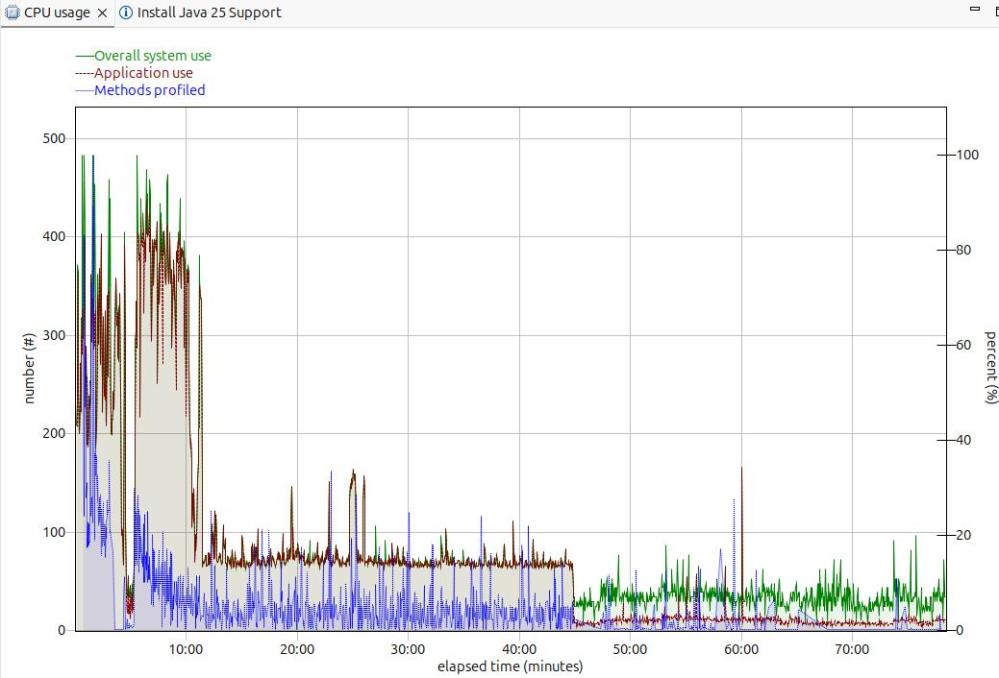
Long term monitoring.

f

From this diagram you can see the JVM startup, the initial part of my test where the JVM was warming up, the remainder of the test, and the JVM overhead after the test.

You need to take all of these into consideration when running performance tests.

Running performance tests

I set up my Work Load Manager configuration to record the number of MQ transactions, and had a report class for the MQWEB server. From this I can calculate the cost per transaction.

Health centre agent logging

With

-Dcom.ibm.diagnostics.healthcenter.logging.level=finest

I had output in the STDERR output

[06:51:52] com.ibm.diagnostics.healthcenter.Agent FINE: System receiver, version 1.0 
[06:51:52] com.ibm.diagnostics.healthcenter.Agent FINE: /usr/lpp/java/J21.0_64//lib/libhcapiplugin.so, version 1.0
[06:51:52] com.ibm.diagnostics.healthcenter.java FINE: Health Center Agent 4.0.7
06:51:53com.ibm.java.diagnostics.healthcenter.agent.mbean.HCLaunchMBean <init>
INFO: Agent version "3.0.21.202109031203"
06:51:56 com.ibm.java.diagnostics.healthcenter.agent.mbean.HCLaunchMBean startAgent
INFO: Health Center agent running in off mode.
06:51:56 com.ibm.java.diagnostics.healthcenter.agent.mbean.HCLaunchMBean startAgent
INFO: Health Center agent started on port 1972.

and in STDOUT many

com.ibm.lang.management.OperatingSystemMXBean.getTotalPhysicalMemory() 

One minute networking: getting your data to flow around the corner; IP tunnelling

This is another of the little bits of networking knowledge, which, once you understand it, is obvious! Some of the documentation on the web is either wrong or is missing information.

The original problem

I wanted to use a route management protocol (OSPF) for managing the routing information known by each router. It has its own format packets. Not every device or router supports these packets.

You configure the interface name, and the OSPF data flows through the interface.

When the connection is a direct line, the data is passed to the remote system and it can use it. When the connection is indirect, for example via a wireless router. The wireless router does not know how to handle the OSPF packets and throws them away. The result is that my remote machine does not get the OSPF packets.

The solution – use a tunnel

One solution is to wrap the packets of data, so they get passed up to the router, round the corner, and back down to the remote system.

When I was employed, we had an internal mail system for paper correspondence . If we wanted to send a letter to a different site, we took the piece of internal mail, put it in an envelope and sent it through the national mail to the remote site. At the remote site, the mail room removed the external envelope, and sent the internal letter on to the recipient. It is a similar process with IP tunnelling.

I have a laptop with IP address A.B.C.D and a server with address W.X.Y.Z., I can ping from A.B.C.D to W.X.Y.Z, so there is an existing path between the machines.

You define a tunnel to W.X.Y.Z (the external envelope) and give which interface address on your system it should use. (Think of having two mail boxes for your letter, one for Royal Mail, another for FedEx).

You define a route so as to say to get to address p.q.r.s use tunnel ….

The definitions

The wireless interface for my laptop was 192.168.1.222 . The wireless address of my server was 192.168.1.230

I defined a tunnel from Laptop to Server called LS

sudo ip tunnel add LS mode gre local 192.168.1.222 remote 192.168.1.230 

Make it active and define the address on the server 192.168.3.3 .

sudo ip link set LS  up
sudo ip route add 192.168.3.3 dev LS

If I ping 192.168.3.3 the enveloped packet goes to the server machine 192.168.1.230 . If this address is defined on the server the ping sends a response – and the ping worked!

Except it didn’t quite. The packet got there, but the response did not get back to my laptop.

At the server the ping “from” IP address was 10.1.0.2, attached to my laptop’s Ethernet. This was not known on the server.

I had three choices

  • Define a tunnel back from the server to the laptop.
  • Use ping -I 192.168.1.222 192.168.3.3 which says send the ping request to 192.168.1.1 , and set the originator address to 192.168.1.222. The server knows how to route to this address.
  • Define a route from the server back to my laptop.

The simplest option was to use ping -I … because no additional definitions are required.

This does not solve my problem

To get OSPF data from the server to my laptop, I need a tunnel from the server to my laptop; so a tunnel each way

Different sorts of data are used in an IP network

  • IPV6 and IPV4 – different network addressing schemes
  • unicast and multi cast.
    • Unicast – Have one destination address, for example ping, or ftp
    • Multicast – Often used by routers and switches. A router can send a multicast broadcast to all nodes on the local network for example ‘does any nodes have IP address a.b.c.d?‘. The data is cast to multiple nodes.

When I defined the tunnel above I initially specified mode ipip. There are different types of tunnel mode ipip is just one. The list includes

  • ipip – Virtual tunnel interface IPv4 over IPv4 can send unicast traffic, not multi cast
  • sit – Virtual tunnel interface IPv6 over IPv4.
  • ip6tnl – Virtual tunnel interface IPv4 or IPv6 over IPv6.
  • gre – Virtual tunnel interface GRE over IPv4. This supports IPv6 and IPv4, unicast and multicast.
  • ip6gre – Virtual tunnel interface GRE over IPv6. This supports IPv6 and IPv4, unicast and multicast.

The mode ipip did not work for the OSPF data.

I guess that the best protocol is gre.

Setting up a gre tunnel

You may need to load the gre functionality

sudo modprobe ip_gred
lsmod | grep gre

create your tunnel

sudo ip tunnel add GRE mode grep local 192.168.1.222 remote 192.168.1.230 
sudo ip link set GRE up
sudo ip route add 192.168.3.3 dev GRE

and you will a matching definition with the same mode at the remote end.

Displaying the tunnel

The command

ip link show dev AB 

gives information like

9: AB@NONE: mtu 1476 qdisc noqueue state UNKNOWN mode DEFAULT group default qlen 1000 link/gre 192.168.1.222 peer 192.168.1.230

where

  • link/gre this was defined using mode gre
  • 192.168.1.222 the local interface to be used to send the traffic
  • peer 192.168.1.230 the IP address for the far end

The command

ip route 

gave me

192.168.3.3 dev AB scope link

so we can see it gets routed over link(tunnel AB).

Using the tunnel

I could use the tunnel name in my defintions, for example for OSPF

interface AB
area 0.0.0.0

One minute networking: TCP buffer sizes

When data flows over a TCPIP connection there are several factors which control the rate at which data can be sent. You can influence some of these factors.

Data is sent as packets typically of size about 1440 bytes – because old hardware could only support this. You could use larger packets, but you may hit a router which chops it into smaller blocks.

The basic TCPIP flow

Consider a Client Server connection. The client application wants to send some data to a server application

  • The client uses send() to put some data into a TCPIP buffer and returns.
  • TCPIP sends some data (a packet) from this buffer, sets a timer and waits.
  • The server receives the data, end sends back an ACK saying so far I have received this many bytes from you.
  • The application on the server does a receive (if there is no data, the application is suspended until data arrives). If there is enough data to satisfy the receive, the application returns, otherwise it is suspended.
  • At the client end, when TCPIP has received the ACK. It no longer needs the data which has just been acknowledged. It can send more data.
  • If no ACK was received and the timer has timed out, TCPIP resend the data.

There are several parts to this:

  • Putting things into the pipe – the send buffer
  • The pipe
  • Getting things from the pipe, the receive buffer

The send buffer

  • TCPIP has a buffer for its use.
  • The application
    • An application does a send() and passes data to TCPIP.
    • If there is space in the TCPIP buffer, the data is moved into the buffer, and the application returns.
    • If there is not enough space for all of the data, enough data is moved to fill the buffer, and the application waits until more space is available in the buffer.
    • When all of the data has been passed to the TCPIP buffer, the application returns, and can do more application work.
  • TCPIP
    • TCPIP takes a chunk of the buffer (a packet) , sends it over the network, and sets a timer.
    • It can then process another chunk of data, and send it over the network, so there are multiple packets in flight.
    • When the far end has passed the data to the application, it sends the ACK back.
    • The local end, when it has received the ACK for a chunk of data, knows the data has been received by TCPIP at the remote end, it no longer needs to keep a copy of the data, and frees up the space on the buffer.

How big a buffer is needed to get good throughput?

The data is held in the TCPIP buffers; waiting to be sent plus the round trip time; from when the data was put into the TCPIP buffer, to getting the ACK back. This could be 10s of milliseconds. Multiple packets can be in-flight (perhaps 10s or 100s) which improves the throughput. So send 10 packets; wait, when the first ACK is received, send another packet etc., so there are always 10 packets in flight.

If the buffer is too small the application has to wait. Increasing the send buffer size will increase throughput up to a point (when the application does not have to wait) after this point making it larger may make no difference.

As more data is in flight, the connection needs a bigger send buffer.

An application can set the send buffer size using the SETSOCKOPT call. If this is not used, then there will be a TCPIP default send buffer size. On z/OS this is the system wide TCPCONFIG TCPSENDBFRSIZE …. parameter.

The default used to default to 16KB, and currently is typically 64KB. There is a TCPIP enhancement which says if the send buffer size is larger than 64KB, then TCPIP can dynamically increase it if it will improve performance. See Outbound Right Sizing(ORS).

Note: If you change the system wide send buffer size (TCPCONFIG TCPSENDBFRSIZE on z/OS), this will affect all applications that do not set the size using SETSOCKOPT. You should test this before putting it into production because it may affect many applications.

The receive buffer

At the receiving end, TCPIP has a buffer. Data from the network is put into this buffer. After the data has been put into the buffer, TCPIP sends back an ACK with three fields saying

  • so far I’ve received this many bytes from you
  • I’ve sent you this many bytes
  • my buffer has space for this many bytes

An application does a receive to get the data, if there is insufficient data to satisfy the receive, the application can wait, or return just the data in the buffers, depending on the options.

If the receive buffer is full, any incoming data will be thrown away. If the application does receive the data, then does lots of processing on the data, followed by receive more data etc, the receive buffer may fill up. Some applications receive the data, give the data to a subtask to process, immediately do another receive, and so try to keep the receive buffer empty.

If the amount of arriving data is larger than the free space in the buffer, TCPIP will return “no space left in the buffer” as part of an ACK. The sender then knows to wait. When the application receives the data, and makes space, “x bytes are available in the buffer” is sent as part of the ACK, and the sender can start sending data again. This “space available” is known as the Window Size, and helps regulate the flow of data.

If you think about this for several minutes, you will realise that there is a time lag between the receive available buffer size going to zero, and the sender receiving the ACK saying no space in receive buffer. Any in-flight packets may get thrown away, or the end application may get all the data from the buffer. The “no space left in receive buffer” tells the sender to stop sending data until there is space in the buffer, and the sender may then reduce the amount of in-flight data.

Having a zero sized window means there is a problem that the application is not getting the data from the buffer fast enough.

How big a receive buffer is needed to get good throughput?

If the buffer is too small the application has to wait, and packets may be thrown away.

An application can set the receive buffer size using the SETSOCKOPT call. If this is not used, then there will be a TCPIP default receive buffer size. On z/OS this is the TCPCONFIG TCPRCVBFRSIZE …. parameter.

The maximum receive buffer size is specified in TCPMAXRCVBUFRSIZE.

If the receive buffer size is greater than 64B, then a performance enhancement called Dynamic Right Sizing(DRS) can come into action which automatically increases the buffer size up to 2MB.

Inside the pipe

I have described the sender side filling the send buffer for the connection, and the application on the receiver side taking data from the connection’s receive buffer. I’ll look at the pipe in between.

Data is send across the network in packets. The packets are usually small – for example 1500 bytes for Ethernet. Some protocols support larger packet sizes. Data send within a z/OS can have 56KB packet sizes. The Maximum Segment Size (mss) is the maximum size of the user data in a packet.

If a packet is too large for a device, it may be cut into smaller chunks and then passed on – or the packet may just be dropped.

The simplest and slowest transmission is send one packet and wait for the ACK, then send another packet.

It is much more efficient to send multiple packets. For example send 10 packets, when the first ACK comes back (saying the first packet has been received), send the next packet and so on, so there are always 10 packets (or less) in the pipe.

The amount of data on the network is limited by the smaller of the send buffer size and the receive window size. This means you need both a big send buffer, and a big receive buffer to get maximum throughput.

The TCP window is the maximum number of bytes that can be sent before the ACK must be received. If the network is unreliable it is better to keep the window small to reduce the amount of data that needs to be resent after a missing ACK.

Where can I get more information?

I wrote a blog post about tuning MQ channels which gives additional information.

How do I display this buffer information?

On z/OS you can use

  • TSO NETSTAT CONFIG command reports the default receive buffer size, the default send buffer size, and the default maximum receive buffer size
  • TSO NETSTAT ALL (IPPORT nnnn where nnnn is the port number.
  • TCPMON on GITHUB to monitor the buffer and window sizes in near real time.

On Linux

You can use the command

  • ss -im -at ‘( dport = :21 )’ which displays information about connections with destination port of 21.
  • ss -im -at ‘( dst = 10.1.1.2 )’ which displays information about connections with destination ip address of 10.1.1.2

Is there more information available about buffers and windows?

There is a lot of information on the web, but it is not usually easy to digest.

I thought this article was clear about the different buffers and windows.

How do I change the buffer sizes?

An application can change them using the SETSOCKOPT call see here options SO_RCVBUF and SO_SNDBUF

With some applications, they have a specific way of setting the buffer sizes

  • MQ for midrange RcvBuffSize etc
  • MQ on z/OS use +cpf RECOVER QMGR(TUNE CHINTCPRBDYNSZ nnnnn)
    +cpf RECOVER QMGR(TUNE CHINTCPSBDYNSZ nnnnn)
  • FTP on Linux -x option

Otherwise the system defaults are used.

Other information provided with display commands

Commands like netstat provide other information

For example

  • round trip time – this is average time in millisecond taken for a packet to be sent over the network, and the ACK is received
  • RoundTripVariance – this gives the spread of the response times. It is the sum of the square of each response time. A measure of the spread of the response times is the standard deviation = sqrt((the variance – average round trip time ** 2) /N) where N is the number (of packets sent). If all the packets have the same round trip time, this will be close to zero.
  • Local 0 window count – the number of times there was 0 space in the receive buffer
  • Remote – window count – the number of times the remote end had 0 space in its receive buffer.

Which of my ADCD disks should I move to my SSD device?

I’m working on moving to a newer version of ADCD, but I do not have enough space for all of the ADCD disks, on my SSD drive, so I am using an external USB device. Which of my new files should I move off the USB drive onto my SSD device for best performance?

Background

How much free space do I have on my disk?

The command

df -P /home/zPDT

gave

Filesystem   1024-blocks     Used Available Capacity Mounted on
/dev/nvme0n1p5 382985776 339351984 24105908      94% /home/zPDT

This shows there is not much free space. What is using all of the space?

ls -lSr

the -S is sort by size largest first, the -r is reverse sort, so the largest comes last.

This showed me lots of old ADCD files which I could delete. After I deleted them, df -P showed the disk was only 69% full.

zPDT “disks”

Each device as seen by zPDT is a process. For example

$ps -ef |grep 5079
colin 5079 4792 0 10:21 ? 00:00:00 awsckd --dev=0A94 --cunbr=0001

So process with pid 5079 is running a program awsckd passing in the device number 0A94

Linux statistics

You can access Linux statistics under the /proc tree.

less /proc/5079/io

gave

rchar: 251198496
wchar: 79167416
syscr: 4525
syscw: 1403
read_bytes: 78671872
write_bytes: 78655488
cancelled_write_bytes: 0

rchar: characters read

The number of bytes which this task has caused to be read from storage. This is simply the sum of bytes which this process passed to read(2) and similar system calls. It includes things such as terminal I/O and is unaffected by whether or not actual physical disk I/O was required (the read might have been satisfied from pagecache).

wchar: characters written

The number of bytes which this task has caused, or shall cause to be written to disk. Similar caveats apply here as with rchar.

read_bytes: bytes read

Attempt to count the number of bytes which this process really did cause to be fetched from the
storage layer. This is accurate for block-backed filesystems.

write_bytes: bytes written

Attempt to count the number of bytes which this process caused to be sent to the storage layer.

How to find the hot files

Use the Linux command

grep read_bytes -r /proc/*/io |sort -k2,2 -g

This finds the read_bytes for each process. It then sorts numerically (-g) and displays the output. For example

/proc/5088/io:read_bytes: 55910400
/proc/5078/io:read_bytes: 61440000
/proc/5091/io:read_bytes: 72916992
/proc/5079/io:read_bytes: 78671872
/proc/5076/io:read_bytes: 138698752
/proc/5074/io:read_bytes: 321728512

You can then display the process information

ps -ef |grep 5074

Which gave

… awsckd –dev=0A80 –cunbr=0001

From the devmap ( or z/OS) device 0A80 is C4RES1.

The disks with the most read activity were (in decreasing order) C4RES1, C4SYS1, C4PAGA, USER02, C4CFG1, C4USS1

Turbo start your Java program on z/OS and save a bucket of CPU

This blog post follows on from Some of the mysteries of Java shared classes and gives some CPU figures.

This should help you with any of the Java applications running on z/OS, such as z/OSMF, z/OS Connect, MQWEB, RSEAPI, and ZOWE.

I ran the scenarios on z/OS on zPDT running on my Ubuntu Linux machine, and so the figures are nothing like you may expect on a real z/OS machine – but my figures should show you the potential.

Topics covered:

Overview of Java shared classes

With Java shared classes support, as a Java program starts, and reads the jar and class files and also copies them into memory somewhere. Successive start can use the in memory copy and avoid the read for disk and initial processing.

You can save the in-memory copy to disk, and restore this disk copy to memory, for example across IPLs.

Measurements

I measured the CPU user from the address space once the system was started

The Java program provides a high level trace. I note the time difference between the first message and the “I am up” message

Scenarios

I used three scenarios

  • IPL and start Java program with no share classes
  • Enable shared classes
  • IPL and restore the shared classes, and start the program

No shared classes

ScenarioCPUDuration seconds
First run after IPL 394172
Second run425183

Enable shared classes

I enabled shared classes by using the Java option

-Xshareclasses:verbose,name=rseapi,cachedir=/tmp/,groupAccess,nonpersistent,nonfatal,cacheDirPerm=0777″

ScenarioCPUDuration seconds
run after shared classes enabled 500200
Second run after shared classes enabled 292116
Third run after shared classes enabled25181

IPL and restore snapshot

ScenarioCPUDuration seconds
First run after (IPL and restore snapshot )27499
Second run272121
Third run279116
Fourth run264111

Analysis of the results

Using the shared classes saved CPU in the region of 25% and reduced the elapsed time by about a half.

The first time the Java program runs and creates the shared class data has a higher CPU cost, and increased elapsed time. The savings of CPU and elapsed time when the shared cache is reused outweighs this one time cost.

Observation

It appears that each time you restart using shared classes the CPU drops. I think this is due to the optimisation being done on the classes, but it may be some totally different effect – or it may just be co-incidence!

Setting up to use the shared classes

I added two job steps to my Java program JCL

Before – restore the share classes cache from the backup copy

// EXPORT SYMLIST=* 
// SET J='/usr/lpp/java/J8.8_64/J8.0_64/bin' 
// SET C='/tmp/' 
// SET N='rseapi' 
// SET V='restoreFromSnapshot'
// SET Q='cacheDirPerm=0777,groupAccess' 
//RESTORE  EXEC PGM=BPXBATCH,REGION=0M,PARMDD=PARMDD 
//PARMDD  DD *,SYMBOLS=(JCLONLY) 
SH &J/java -Xshareclasses:cacheDir=&C,name=&N,&V,&Q 
/* 

If the in-memory cache exists you get message

JVMSHRC726E Non-persistent shared cache “rseapi” already exists. It cannot be restored from the snapshot.

After – save the shared class cache to disk

// SET V='snapshotCache' 
// SET J='/usr/lpp/java/J8.8_64/J8.0_64/bin' 
//SAVECAC  EXEC PGM=BPXBATCH,REGION=0M, 
//   PARM='SH &J/java -Xshareclasses:cacheDir=&C,name=&N,&V' 
//STDERR   DD   SYSOUT=* 
//STDOUT   DD   SYSOUT=* 

Strange behaviour

By using the startup option -verbose:class,dynload you can get information about the classes as they are loaded.

When not using shared classes, there were records saying <Loaded ….. and giving durations of the loads etc.

When using shared classes there were still a few instances of <Loaded… . I could not find out why some classes were read from disk , and the rest were read from the shared classes cache.

If we could fix these, then the startup would be even faster!

After some investigation I can explain some of the strange behaviour.

  • When a jar is first used there is a <Loaded… for the class that requested the jar.
  • A class like <Loaded sun/reflect/GeneratedMethodAccessor1 with a number at the end gets a <Loader… entry.
  • Some other classes in a jar file get loaded using <Loader… though they do not look any different to classes which are loaded from the shared cache!

All in all, very strange.

Where do you harden the cache to?

By default the cache is saved to /tmp. As /tmp is often cleared at IPL, this means the cache will not exist across IPLs. You may wish to save it in an instance specific location such as /var/myprogram.

What happens if I change my Java program?

I had a small test program which I recompiled, and created the jar file. The Java source was

public class hw   { 
  public static void main(String[] args) throws Exception { 
    System.out.println("This will be printed"); 
    System.out.println("HELLo" )  ; 
    CPUtil.print(); // this prints Util.line 10 
    hw2.print(); 
  } 
} 

When I reran the program the output contained

JVMSHRC169I Change detected in /u/adcd/hw.jar... 
  ...marked 3 cached classes stale 
class load: sun/launcher/LauncherHelper$FXHelper from: .../lib/rt.jar 
<Loaded CPUtil> 
<  Class size 427; ROM size 416; debug size 0> 
<  Read time 4 usec; Load time 108 usec; Translate time 595 usec> 
class load: CPUtil from: file:/u/adcd/hw.jar 
Output from CPUtil.line 10 
<Loaded hw2> 
<  Class size 386; ROM size 368; debug size 0> 
<  Read time 3 usec; Load time 107 usec; Translate time 635 usec> 
class load: hw2 from: file:/u/adcd/hw.jar 

Where you can see output from my program is intermixed with the loader activity.

What happens internally

From the previous topic, it seems that Java has to read the files on disk for example to spot that a class has changed. This may just be a matter of reading the time stamp of the file on disk,or it may go into the file itself.

Should I use .class files or package the .class files into a .jar files?

This will be a hand waving type answer. Generally the answer is use a .jar file.

Use one .jar fileUse multiple .class files
One directory access and one security access check should reduce the CPU usage.Multiple directory access and multiple security checks are required.
Reading one large file may be faster than reading many smaller files. An I/O has “set-up I/O”, “transfer data”, “shutdown I/O” there is one set-up and one shutdown.Each file I/O has set-up and shutdown time as well as the transfer time and is generally slower than processing bigger files. (Think about large block sizes for data sets).
The .jar files are compressed so there is less data to transfer. The decompression of the jar file takes CPU.Files do not need to be decompressed
For integrity reasons you can have your .jar file cryptographically signed.You cannot sign .class files.

Should I use of BPXBATCH or BPXBATSL?

In the Tomcat script for starting the web server it issued

exec "/usr/lpp/java/J8.8_64/J8.0_64/bin/java" ...  &

The & makes it run in the background. As I was running this as a started task, this seemed unnecessary and removed the &.

I also used EXEC PGM=BPXBATSL instead of EXEC PGM=BPXBATCH

The combination of both reduced the start time significantly!

I had to specify environment variable _BPX_SPAWN_SCRIPT=YES to be able to run the script. Without it I got

BPXM047I BPXBATCH FAILED BECAUSE SPAWN (BPX1SPN) OF … FAILED WITH RETURN CODE 00000082 REASON CODE 0B1B0C27

Problems I experienced while setting this up.

Group access

When restoring from a snapshot I used

java -Xshareclasses:cacheDir=/tmp,name=rseapi’,restoreFromSnapshot’, cacheDirPerm=0777,groupAccess’

Which worked.

When I omitted the group Access I had the following messages in stderr of my Java program.

JVMSHRC020E An error has occurred while opening semaphore 
JVMSHRC336E Port layer error code = -197358 
JVMSHRC337E Platform error message: semget : EDC5111I Permission denied. 
JVMSHRC028E Permission Denied 
JVMSHRC670I Error recovery: attempting to use shared cache in readonly mode if the shared memory region exists, in response to "-Xshareclasses:nonfatal" option.                                                                                                                      
JVMSHRC659E An error has occurred while opening shared memory 
JVMSHRC336E Port layer error code = -393966 
JVMSHRC337E Platform error message: shmget : EDC5111I Permission denied. 
JVMSHRC028E Permission Denied 
JVMSHRC627I Recreation of shared memory control file is not allowed when running in read-only mode. 
JVMSHRC840E Failed to start up the shared cache. 
JVMSHRC686I Failed to startup shared class cache. Continue without using it as -Xshareclasses:nonfatal is specified c

The OMVS command ipcs -m gave

>ipcs -m
IPC status as of Mon Aug 21 17:33:54 2023
Shared Memory:
T ID KEY MODE OWNER GROUP
m 8196 0x6100c70e --rw-rw---- OMVSKERN SYS1
m 8197 0x6100c30e --rw------- OMVSKERN STCGROUP

When the correct group access was specified the ipcs -m command gave

>ipcs -m
IPC status as of Mon Aug 21 17:38:40 2023                         
Shared Memory:                                                    
T         ID     KEY        MODE       OWNER    GROUP             
m       8196 0x6100c70e --rw-rw---- OMVSKERN     SYS1             
m      73733 0x6100c30e --rw-rw---- OMVSKERN STCGROUP             

and the group mode has values -rw.

Wrong owner

I submitted a job to run Java which created the shared cache. I then tried running the same program using a started task with a different userid.

The cache on disk had access

-rw-rw----   1 COLIN    SYS1          32 Aug 25 11:05 C290M4F1A64_semaphore_zosmf_G41L00       
-rw-rw----   1 COLIN    SYS1          40 Aug 25 11:05 C290M4F1A64_memory_zosmf_G41L00          

But my started task was running with a different userid and group.

I got messages

JVMSHRC684E An error has occurred while opening semaphore. Control file could not be locked.         
JVMSHRC336E Port layer error code = -102                                                             
JVMSHRC337E Platform error message: EDC5111I Permission denied. (errno2=0xEF076015)                  
JVMSHRC028E Permission Denied                                                                        

I delete the cache entries, and restarted the started task. I also added another step to the started task to issue snapshotCache.

Performance tuning at the instruction level is weird

This post came out of a presentation on performance which I gave to some Computer Science students.

When I first joined the IBM MQ performance team, I was told that it was obvious that register/register instructions were fast, and storage/register were slow. Over time I found is not always true, I’ll explain why below…

For application performance there are some rules of thumb,

  • Use the most modern compilers, as they will have the best optimisation and use newer, faster instructions
  • Most single threading applications will gain from using the best algorithms, and storage structures, but they may gain very little from trying to tune which instructions to use.
  • Multi threading programs may get benefit from designing their programs so they do not interact at the instruction level.

You may do a lot of work to tune the code – and find it makes no difference. You change one field, and it can make a big difference. You think you understand it – and find you do not.

Background needed to understand the rest of the post.

Some of what I say is true. Some of what I say may be false – but you it will help you understand – even though it is false. For example, the table in front of me is solid and made out of wood. That is not strictly accurate. Atoms are mainly empty space. Saying the table is solid, is a good picture, but strictly inaccurate.

I spent my life working with the IBM 390 series and the description below is based on it – but I’ve changed some of it to keep it simple.

Physical architecture

The mainframe has an instruction “Move Character Long” (MVCL). If you get microscope and look at the processor chips, you will not find any circuitry which implements this instruction. This instruction is implemented in the microcode.

Your program running on a processor is a bit like Java byte codes. The microcode reads storage and finds an instruction and executes it.

For an instruction “move data from a virtual address into a register”, the execution can be broken down into steps

  1. Read memory and copy the instruction and any parameters
  2. Parse the data into operation-code, registers, and virtual storage address
  3. Jump to the appropriate code for the operation code
  4. Convert the virtual storage address into a real page address (in RAM). This is complex code. Every thread has its own address say, 4 000 000 , so you need the thread-look-up tables to get the “real address” for that thread. Your machine may be running virtualised, so the the “real address” needs a further calculation of the next level of indirection.
  5. “Lock” the register” and “lock” the real address of the data
  6. Go and get the data from storage
  7. Move the data into the register
  8. Unlock the register, unlock the real address of the data
  9. End.

Where is the data?

There is a large (TB) of RAM in the physical box. The processor “chips” are in books (think pluggable boards). The “chips” are about the size of my palm, one per book. There is cache in the books. Within the “chips” are multiple CPUs, storage management processors and more cache.

The speed of data access depends on the speed of light.

  • To get from the RAM storage to the CPU, the distance could be 100 cm – or 3 nanoseconds
  • To get from the book’s cache storage to the CPU this could be 10 cm or about 0.3 nanoseconds
  • The time for the CPU to access the memory on the chip is about 0.03 nano seconds.

The time for “Go and get the data from storage” (above) depends on where the data is. The first access may take 3 nano seconds when the data is read from RAM, if a following instruction uses the same data, it is already in the CPU cache, and so take 0.03 nanoseconds ( 100 times faster).

How is the program executed?

In the flow of an instruction (above) each stage is executed in a production line known as a pipeline. There are usually multiple instructions being processed at the same time.

While one instruction is in the stage “Convert the virtual storage address into a real page address”, another instruction is being parsed and so on.

If we had instructions

  1. Load register 5 from 4 000 000
  2. Load register 4 from register 5
  3. Clear register 6
  4. Clear register 7

Instruction 2 (Load register 4 from register 5) needs to use register 4 and cannot execute until the first instruction has finished. Instruction 2 has to has to wait until instruction 1 has finished. This shows that a register to register instruction may not be the fastest; it has to wait for a previous instruction to finish.

A clever compiler can reorder the code

  1. Load register 5 from 4 000 000
  2. Clear register 6
  3. Clear register 7
  4. Load register 4 from register 5

and so this code may execute faster because the clear register instructions can execute without changing the logic of the program. By the time the clear register instructions have finished, register 4 may be available.

If you look at code generated from a compiler, a register may be initialised many instructions away from where it is next used.

The hardware may be able to reorder these instructions; as long as they end in the correct order!

Smarter use of the storage and cache

Data is read and written to storage in “cache lines” these may be blocks of 256, 512 or 1024 byte blocks.

If you have a program with a big control block, you may get benefit from putting hot fields together. If your structure is spread across two cache lines, you may have processing like.

  • Load register 5 from cache block 1. This takes 3 ns.
  • Load register 6 from cache block 2. This takes 3 ns.

If the fields are adjacent you might get

  • Load register 5 from cache block 1. This takes 3 ns.
  • Load register 6 from cache block 1. This takes 0.03 ns because the cache block is already in the CPU’s cache.

Use faster instructions

Newer generations of CPUs can have newer and faster instructions. To load a register with the constant value – say 5. In the old days, it had to read this value from storage. Newer instructions may have the value(5) as part of the instruction – so no storage access is required, and so the instruction should be faster.

The second time round a loop may be faster than the first time around a loop.

The stages of the production line may cache data, for example converting a virtual address to a real page address. The stage may look in it’s cache – if not found then do the expensive calculation. If it is found then use the value directly.

If your program is using the same address (same page) the second time round the loop, the the real address of the data may already be in the CPU cache. The first time may have had to go to RAM, the second time the data is in the CPU cache.

This can all change

Consider the scenario where the first time round the loop was 100 times slower than later loop iterations – it may all suddenly change. Your program is un-dispatched to let someone else’s program run. When your program is re-dispatched, the cached values may no longer be available, so your program has a slow iteration while the real address of you virtual page is recalculated, and the data read in from RAM.

Multi programming interactions.

If you have multiple instances of your program running accessing shared fields, you can get interference at the instruction level.

Consider a program executing

  • Add value 1 to address 4 000 000

Part of the execution of this is to take a lock on the cache line with address 4 000 000. If another CPU executes the same instruction, the second CPU will have to wait until the first CPU has finished with it. If both CPUs are on the same chip the delay may be small (0.03 ns). If the CPUs are in different chips (in different books) it will take 0.3 nanoseconds to notify the second CPU.

If lots of CPUs are trying to access this field there will be a long access time.

You should design your program so each instance has its own cache line, so the CPUs do not compete for storage. I know of someone who did this and got 30% throughput improvement!

Configuring the hardware for virtual machines.

You should also consider how you configure your hardware. If you give each virtual machine CPUs on the same chip, then any interference should be small. If a virtual machine has CPUs in different books (so takes 0.3 nano seconds to talk to the other CPU) the interference will be larger because the requests take longer. Ive seen performance results vary by a couple of percentages because the CPUs allocated to a virtual machine were different on the second run.

Going deeper into the murk

If you have virtual machines sharing the same CPUs, this may affect your results, because your virtual machine may be un-dispatched, and another virtual machine is dispatched on the processor(s). The cached values for your virtual machine may be been overwritten.

Improving application performance – why, how ?

I’m working on a presentation on performance, for some university students, and I thought it would be worth blogging some of the content.

I had presented on what it was like working in industry, compared to working in a university environment. I explained what it is like working in a financial institutions; where you have 10,000 transactions a second, transactions response time is measured in 10s of milliseconds, and if you are down for a day you are out of business. After this they asked how you tune the applications and systems at this level of work.

Do you need to do performance tuning?

Like many questions about performance the answer is it depends….. it comes down to cost benefit analysis. How much CPU (or money) will you save if you do analysis and tuning. You could work for a month and save a couple of hundred pounds. You could work for a day and find CPU savings which means you do not need to upgrade your systems, and so save lots of money.

It is not usually worth doing performance analysis on programs which run infrequently, or are of short duration.

Obvious statements

When I joined the performance team, the previous person in the role had left a month before, and the hand over documentation was very limited. After a week or so making tentative steps into understanding work, I came to the realise the following (obvious once you think about it) statements

  • A piece of work is either using CPU or is waiting.
  • To reduce the time a piece of work takes you can either reduce the CPU used, or reduce the waiting time.
  • To reduce the CPU you need to reduce the CPU used.
  • The best I/O is no I/O
  • Caching of expensive operations can save you a lot.

Scenario

In the description below I’ll cover the moderately a simple case, and also the case where there are concurrent threads accessing data.

Concurrent activity

When you have more than one thread in your application you will need to worry about data consistency. There are locks and latches

  • Locks tend to be “long running” – from milliseconds to seconds. For example you lock a database record while updating it
  • Latches tend to be held across a block of code, for example manipulation of lists and updating pointers.

Storing data in memory

There are different ways of storing data in memory, from arrays, hash tables to binary trees. Some are easy to use, some have good performance.

Consider having a list of 10,000 names, which you have to maintain.

Array

An array is a contiguous block of memory with elements of the same size. To locate an element you calculate the offset “number of element” * size of element.

If the list is not sorted, you have to iterate over the array to find the element of interest.

If the list is sorted, you can do a binary search, for example if the array has 1000 elements, first check element 500, and see if the value is higher or lower, then select element 250 etc.

An array is easy to use, but the size is inflexible; to change the size of the array you have to allocate a new array, copy old to new, release old.

Single Linked list

This is a chain of elements, where each element points to the next, the there is a pointer to the start of the chain, and something to say end of chain ( often “next” is 0).

This is flexible, in that you can easily add elements, but to find an element you have to search along the chain and so this is not suitable for long chains.

You cannot easily delete an element from the chain.

If you have A->B->D->Q. You can add a new element G, by setting G->Q, and D->G. If there are multiple threads you need to do this under a latch.

Doubly linked lists

This is like a single linked list, but you have a back chain as well. This allows you to easily delete an element. To add an element you have to update 4 pointers.

This is a flexible list where you can add and remove element, but you have to scan it sequentially to find the element of interest, and so is not suitable for long chains.

If there are multiple threads you need to do this under a latch.

Hash tables

Hash tables are a combination of array and linked lists.

You allocate an array of suitable size, for example 4096. You hash the key to a value between 0 and 4095 and use this as the index into the array. The value of the array is a linked list of elements with the same hash value, which you scan to find the element of interest.

You need a hash table size so there are a few (up to 10 to 50) elements in the linked list. The hash function needs to produce a wide spread of values. Having a hash function which returned one value, means you would have one long linked list.

Binary trees

Binary trees are an efficient way of storing data. If there are any updates, you need to latch the tree while updates are made, which may slow down multi threaded programs.

Each node of a tree has 4 parts

  • The value of this node such as “COLIN PAICE”
  • A pointer to a node for values less than “COLIN PAICE”
  • A pointer to a node for values greater than “COLIN PAICE”
  • A pointer to the data record for this node.

If the tree is balanced the number of steps from the start of the tree to the element of interest is approximately the same for all elements.

If you add lots of elements you can get an unbalanced tree where the tree looks like a flag pole – rather than an apple tree. In this case you need to rebalanced the tree.

You do not need to worry about the size of the tree because it will grow as more elements are added.

If you rebalance the tree, this will require a latch on the tree, and the rebalancing could be expensive.

There are C run time functions such as tsearch which walks the tree and if the element exists in the tree, it returns the node. If it did not exist in the tree, it adds to the free, and returns the value.

This is not trivial to code – (but is much easier than coding a tree yourself).

You need to latch the tree when using multiple threads, which can slow down your access.

Optimising your code

Take the scenario where you write an application which is executed a 1000 times a second.

int myfunc(char * name, int cost, int discount)
{
  printf(“Values passed to myfunc %s cost discount" i\n”,name,cost,discount);
  rc= dosomething()  
  rc = 0;
  printf(“exit from myfunc %i\n”,rc);
  return rc;
}

Note: This is based on a real example, I went to a customer to help with a performance problem, and found the top user was printf() – printing out logging information. They commented this code out in all of their functions and it went 5 times faster

You can make this go faster by having a flag you set to produce trace output, so

if (global.trace ) 
    printf(“Values passed to myfunc %s cost discount" i\n”,name,cost,discount);

You could to the same for the exit printf, but you may want to be more subtle, and use

if (global.traceNZonexit  && rc != 0)
   printf(“exit from myfunc %i\n”,rc);

This is useful when the return code is 0 most of the time. It is useful if someone reports problems with the application – and you can say “there is a message access-denied” at the time of your problem.

FILE * hFILE = 0;
for ( I = 0;i < 100;i ++)
    /* create a buffer with our data in it */
    lenData =  sprintf(buffer,”userid %s, parm %s\n”, getid(), inputparm); 
    error = ….()
    if (error > 0)
    {
     hFILE = fopen(“outputfile”,”a);
     fwrite(buffer,1,lenData,fFile)
     fclose(hFile)
    }
…
}

This can be improved

  • by moving the getid() out of the loop – it does not change within the loop
  • move the lenData = sprintf.. within the error loop.
  • change the error loop
{
  ... 
  if (error > 0)
  {
     if (hFile == 0 )
     {  
        hFILE = fopen(“outputfile”,”a”);
        pUserid = strdup(getuserid());  
     } 
     fwrite(buffer,1,lenData,fFile)     
  }
...
}
if (hFile > 0) 
   fclose(hFile);

You can take this further, and have the file handle passed in to the function, so it is only opened once, rather than every time the function is invoked.

main()
{
   struct {FILE * hFile
      …
    } threadBlock
   for(i=1,i<9999,i++)
   myprog(&threadBlock..}
   if (threadBlock →hFile != 0 )fclose(theadBlock → hFile);
   }
}
// subroutine
   myprog(threadblock * pt....){
...

  if (error > 0)
  {
     if (pt -> hFile == 0 )
     {  
        pt -> hFile= fopen(“outputfile”,”a”);       
     } 
     fwrite(buffer,1,lenData,pt -> hFile)
  }
   

Note: If this is a long running “production” system you may want to open the file as part of application startup to ensure the file can be opened etc, rather than find this out two days later.

The best I/O is no I/O

In the course of an email exchange there was discussion about the performance of z/OS where the DASD was involved in an active-active environment – so every write I/O is mirrored over a network. There was a discussion about avoiding disk I/O for work files. VIO refers to data set allocations that exist in paging storage only. z/OS does not use a real device unless z/OS must page out the data set. If course you need enough real storage so you do not page!

In ISMF you can define a storage group, type of VIO which uses Virtual I/O.

I have a Storage Group of SGVIO which says use VIO if the data set size is less than 2000000 KB. If more than this is needed it will use DASD.

If you are in a mirrored environment, and you have DASD volumes which are just used for temporary files, or paging then these volumes do not need to be mirrored. (But you may want to mirror them in case some one puts a non temporary data set on the volume).

One Minute MVS – tuning stack and heap pools

These days many applications use a stack and heap to manage storage used by an application. For C and Cobol programs on z/OS these use the C run time facilities. As Java uses the C run time facilities, it also uses the stack and heap.

If the stack and heap are not configured appropriately it can lead to an increase in CPU. With the introduction of 64 bit storage, tuning the heap pools and stack is no longer critical. You used to have to carefully manage the stack and heap pool sizes so you didn’t run out of storage.

The 5 second information on what to check, is the number of segments freed for the stack and heap should be zero. If the value is large then a lot of CPU is being used to manage the storage.

The topics are

Kinder garden background to stack.

When a C (main) program starts, it needs storage for the variables uses in the program. For example

int i;
for (ii=0;ii<3:ii++)
{}

char * p = malloc(1024);

The variables ii and p are variables within the function, and will be on the functions stack. p is a pointer.

The block of storage from the malloc(1024) will be obtained from the heap, and its address stored in p.

When the main program calls a function the function needs storage for the variables it uses. This can be done in several ways

  1. Each function uses a z/OS GETMAIN request on entry, to allocate storage, and a z/OS FREEMAIN request on exit. These storage requests are expensive.
  2. The main program has a block of storage which functions can use. For the main program uses bytes 0 to 1500 of this block, and the first function needs 500 bytes, so uses bytes 1501 to 2000. If this function calls another function, the lower level function uses storage from 2001 on wards. This is what usually happens, it is very efficient, and is known as a “stack”.

Intermediate level for stack

It starts to get interesting when initial block of storage allocated in the main program is not big enough.

There are several approaches to take when this occurs

  1. Each function does a storage GETMAIN on entry, and FREEMAIN on exit. This is expensive.
  2. Allocate another big block of storage, so successive functions now use this block, just like in the kinder garden case. When functions return to the one that caused a new block to be allocated,
    1. this new block is freed. This is not as expensive as the previous case.
    2. this block is retained, and stored for future requests. This is the cheapest case. However a large block has been allocated, and may never be used again.

How big a block should it allocate?

When using a stack, the size of the block to allocate is the larger of the user specified size, and the size required for the function. If the specified secondary size was 16KB, and a function needs 20KB of storage, then it will allocate at least 20KB.

How do I get the statistics?

For your C programs you can specify options in the #PRAGMA statement or, the easier way, is to specify it through JCL. You specify C run time options through //CEEOPTS … For example

//CEEOPTS DD *
STACK(2K,12K,ANYWHERE,FREE,2K,2K)
RPTSTG(ON)

Where

  • STACK(…) is the size of the stack
  • RPTSTG(ON) says collect and display statistics.

There is a small overhead in collecting the data.

The output is like:

STACK statistics:                                                
  Initial size:                                2048     
  Increment size:                             12288     
  Maximum used by all concurrent threads:  16218808     
  Largest used by any thread:              16218808     
  Number of segments allocated:                2004     
  Number of segments freed:                    2002     

Interpreting the stack statistics

From the above data

  • This shows the initial stack size was 2KB and an increment of 12KB.
  • The stack was extended 2004 times.
  • Because the statement had STACK(2K,12K,ANYWHERE,FREE,2K,2K), when the secondary extension became free it was FREEMAINed back to z/OS.

When KEEP was used instead of FREE, the storage was not returned back to z/OS.

The statistics looked like

STACK statistics:                                                
  Initial size:                               2048     
  Increment size:                            12288     
  Maximum used by all concurrent thread:  16218808     
  Largest used by any thread:             16218808     
  Number of segments allocated:               1003     
  Number of segments freed:                      0     

What to check for and what to set

For most systems, the key setting is KEEP, so that freed blocks are not released. You can see this a) from the definition b) Number of segments freed is 0.

If a request to allocate a new segment fails, then the C run time can try releasing segments that are not in use. If this happens the “”segments freed” will be incremented.

Check that the “segments freed” is zero, and if not, investigate why not.

When a program is running for a long time, a small number of “segments allocated” is not a problem.

Make the initial size larger, closer to the “Largest used of any thread” may improve the storage utilisation. With smaller segments there is likely to be unused space, which was too small for a functions request, causing the next segment to be used. So a better definition would be

STACK(16M,12K,ANYWHERE,KEEP,2K,2K)

Which gave

STACK statistics:                                                          
  Initial size:                                     16777216               
  Increment size:                                      12288               
  Maximum used by all concurrent threads:           16193752               
  Largest used by any thread:                       16193752               
  Number of segments allocated:                            1               
  Number of segments freed:                                0               

Which shows that just one segment was allocated.


Kinder garden background to heap

When there is a malloc() request in C, or a new … in Java, the storage may exist outside of the function. The storage is obtained from the heap.

The heap has blocks of storage which can be reused. The blocks may all be of the same size, or or different sizes. It uses CPU time to scan free blocks looking for the best one to reuse. With more blocks it can use increasing amounts of CPU.

There are heap pools which avoids the costs of searching for the “right” block. It uses a pools of blocks. For example:

  1. there is a heap pool with 1KB fixed size blocks
  2. there is another heap pool with 16KB blocks
  3. there is another heap pool with 256 KB blocks.

If there is a malloc request for 600 bytes, a block will be taken from the 1KB heap pool.

If there is a malloc request for 32KB, a block would be used from the 256KB pool.

If there is a malloc request for 512KB, it will issue a GETMAIN request.

Intermediate level for heap

If there is a request for a block of heap storage, and there is no free storage, a large segment of storage can be obtained, and divided up into blocks for the stack. If the heap has 1KB blocks, and a request for another block fails, it may issue a GETMAIN request for 100 * 1KB and then add 100 blocks of 1KB to the heap. As storage is freed, the blocks are added to the free list in the heap pool.

There is the same logic as for the stack, about returning storage.

  1. If KEEP is specified, then any storage that is released, stays in the thread pool. This is the cheapest solution.
  2. If FREE is specified, then when all the blocks in an additional segment have been freed, then free the segment back to the z/OS. This is more expensive than KEEP, as you may get frequent GETMAIN and FREEMAIN requests.

How many heap pools do I need and of what size blocks?

There is usually a range of block sizes used in a heap. The C run time supports up to 12 cell sizes. Using a Liberty Web server, there was a range of storage requests, from under 8 bytes to 64KB.

With most requests there will frequently be space wasted. If you want a block which is 16 bytes long, but the pool with the smallest block size is 1KB – most of the storage is wasted.
The C run time gives you suggestions on the configuration of the heap pools, the initial size of the pool and the size of the blocks in the pool.

Defining a heap pool

How to define a heap pool is defined here.

You specify the size of overall size of storage in the heap using the HEAP statement. For example for a 16MB total heap size.

HEAP(16M,32768,ANYWHERE,FREE,8192,4096)

You then specify the pool sizes


HEAPPOOL(ON,32,1,64,2,128,4,256,1,1024,7,4096,1,0)

The figures in bold are the size of the blocks in the pool.

  • 32,1 says maximum size of blocks in the pool is 32 bytes, allocate 1% of the heap size to this pool
  • 64,2 says maximum size of blocks in the pool is 64 bytes, allocate 2% of the heap size to this pool
  • 128,4 says maximum size of blocks in the pool is 128 bytes, allocate 4% of the heap size to this pool
  • 256,1 says maximum size of blocks in the pool is 256 bytes, allocate 1% of the heap size to this pool
  • 1024,7 says maximum size of blocks in the pool is 1024 bytes, allocate 7% of the heap size to this pool
  • 4096,1 says maximum size of blocks in the pool is 4096 bytes, allocate 1% of the heap size to this pool
  • 0 says end of definition.

Note, the percentages do not have to add up to 100%.

For example, with the CEEOPTS

HEAP(16M,32768,ANYWHERE,FREE,8192,4096)
HEAPPOOLS(ON,32,50,64,1,128,1,256,1,1024,7,4096,1,0)

After running my application, the data in //SYSOUT is


HEAPPOOLS Summary:                                                         
  Specified Element   Extent   Cells Per  Extents    Maximum      Cells In 
  Cell Size Size      Percent  Extent     Allocated  Cells Used   Use      
  ------------------------------------------------------------------------ 
       32        40    50      209715           0           0           0 
       64        72      1        2330           1        1002           2 
      128       136      1        1233           0           0           0 
      256       264      1         635           0           0           0 
     1024      1032      7        1137           1           2           0 
     4096      4104      1          40           1           1           1 
  ------------------------------------------------------------------------ 

For the cell size of 32, 50% of the pool was allocated to it,

Each block has a header, and the total size of the 32 byte block is 40 bytes. The number of 40 bytes units in 50% of 16 MB is 8MB/40 = 209715, so these figures match up.

(Note with 64 bit heap pools, you just specify the absolute number you want – not a percentage of anything).

Within the program there was a loop doing malloc(50). This uses cell pool with size 64 bytes. 1002 blocks(cells) were used.

The output also has

Suggested Percentages for current Cell Sizes:
HEAPP(ON,32,1,64,1,128,1,256,1,1024,1,4096,1,0)


Suggested Cell Sizes:
HEAPP(ON,56,,280,,848,,2080,,4096,,0)

I found this confusing and not well documented. It is another of the topics that once you understand it it make sense.

Suggested Percentages for current Cell Sizes

The first “suggested… ” values are the suggestions for the size of the pools if you do not change the size of the cells.

I had specified 50% for the 32 byte cell pool. As this cell pool was not used ( 0 allocated cells) then it suggests making this as 1%, so the suggestion is HEAPP(ON,32,1

You could cut and paste this into you //CEEOPTS statement.

Suggested Cell Sizes

The C run times has a profile of all the sizes of blocks used, and has suggested some better cell sizes. For example as I had no requests for storage less than 32 bytes, making it bigger makes sense. For optimum storage usage, it suggests of using sizes of 56, 280,848,2080,4096 bytes.

Note it does not give suggested number of blocks. I think this is poor design. Because it knows the profile it could have an attempt at specifying the numbers.

If you want to try this definition, you need to add some values such as

HEAPP(ON,56,1,280,1,848,1,2080,1,4096,1,0)

Then rerun your program, and see what percentage figures it recommends, update the figures, and test again. Not the easiest way of working.

What to check for and what to set

There can be two heap pools. One for 64 bit storage ( HEAPPOOL64) the other for 31 bit storage (HEAPPOOL).

The default configuration should be “KEEP”, so any storage obtained is kept and not freed. This saves the cost of expensive GETMAINS and FREEMAINs.

If the address space is constrained for storage, the C run time can go round each heap pool and free up segments which are in use.

The value “Number of segments freed” for each heap should be 0. If not, find out why (has the pool been specified incorrectly, or was there a storage shortage).

You can specify how big each pool is

  • for HEAPPOOL the HEAP size, and the percentage to be allocated to each pool – so two numbers to change
  • for HEAPPOOL64 you specify the size of each pool directly.

The sizes you specify are not that sensitive, as the pools will grow to meet the demand. Allocating one large block is cheaper that allocating 50 smaller blocks – but for a server, this different can be ignored.

With a 4MB heap specified

HEAP(4M,32768,ANYWHERE,FREE,8192,4096)
HEAPP(ON,56,1,280,1,848,1,2080,1,4096,1,0)

the heap report was

 HEAPPOOLS Summary: 
   Specified Element   Extent   Cells Per  Extents    Maximum      Cells In 
   Cell Size Size      Percent  Extent     Allocated  Cells Used   Use 
   ------------------------------------------------------------------------ 
        56        64      1         655           2        1002           2 
       280       288      1         145           1           1           0 
       848       856      1          48           1           1           0 
      2080      2088      1          20           1           1           1 
      4096      4104      1          10           0           0           0 
   ------------------------------------------------------------------------ 
   Suggested Percentages for current Cell Sizes: 
     HEAPP(ON,56,2,280,1,848,1,2080,1,4096,1,0) 

With a small(16KB) heap specified

HEAP(16K,32768,ANYWHERE,FREE,8192,4096)
HEAPP(ON,56,1,280,1,848,1,2080,1,4096,1,0)

The output was

HEAPPOOLS Summary:                                                            
  Specified Element   Extent   Cells Per  Extents    Maximum      Cells In    
  Cell Size Size      Percent  Extent     Allocated  Cells Used   Use         
  ------------------------------------------------------------------------    
       56        64      1           4         251        1002           2    
      280       288      1           4           1           1           0    
      848       856      1           4           1           1           0    
     2080      2088      1           4           1           1           1    
     4096      4104      1           4           0           0           0    
  ------------------------------------------------------------------------    
  Suggested Percentages for current Cell Sizes:                               
    HEAPP(ON,56,90,280,2,848,6,2080,13,4096,1,0)                             

and we can see it had to allocate 251 extents for all the request.

Once the system has “warmed up” there should not be a major difference in performance. I would allocate the heap to be big enough to start with, and avoid extensions.

With the C run time there are heaps as well as heap pools. My C run time report gave

64bit User HEAP statistics:
31bit User HEAP statistics:
24bit User HEAP statistics:
64bit Library HEAP statistics:
31bit Library HEAP statistics:
24bit Library HEAP statistics:
64bit I/O HEAP statistics:
31bit I/O HEAP statistics:
24bit I/O HEAP statistics:

You should check all of these and make the initial size the same as the suggested recommended size. This way the storage will be allocated at startup, and you avoid problems of a request to expand the heap failing due to lack of storage during a buys period.

Advanced level for heap

While the above discussion is suitable for many workloads, especially if they are single threaded. It can get more complex when there are multiple thread using the heappools.

If you have a “hot” or highly active pool you can get contention when obtaining and releasing blocks from the heap pool. You can define multiple pools for an element size. For example

HEAPP(ON,(56,4),1,280,1,848,1,2080,1,4096,1,0)

The (56,4) says make 4 pools with block size of 56 bytes.

The output has

HEAPPOOLS Summary:                                                          
  Specified Element   Extent   Cells Per  Extents    Maximum      Cells In  
  Cell Size Size      Percent  Extent     Allocated  Cells Used   Use       
  ------------------------------------------------------------------------  
       56       64     1           4         251        1002           2  
       56       64     1           4           0           0           0  
       56       64     1           4           0           0           0  
       56       64     1           4           0           0           0  
      280       288      1           4           1           1           0  
      848       856      1           4           1           1           0  
     2080      2088      1           4           1           1           1  
     4096      4104      1           4           0           0           0  
  ------------------------------------------------------------------------  

We can see there are now 4 pools with cell size of 56 bytes. The documentation says Multiple pools are allocated with the same cell size and a portion of the threads are assigned to allocate cells out of each of the pools.

If you have 16 threads you might expect 4 threads to be allocated to each pool.

How do you know if you have a “hot” pool.

You cannot tell from the summary, as you just get the maximum cells used.

In the report is the count of requests for different storage ranges.

Pool  2     size:   160 Get Requests:           777707 
  Successful Get Heap requests:    81-   88                 77934 
  Successful Get Heap requests:    89-   96                 59912 
  Successful Get Heap requests:    97-  104                 47233 
  Successful Get Heap requests:   105-  112                 60263 
  Successful Get Heap requests:   113-  120                 80064 
  Successful Get Heap requests:   121-  128                302815 
  Successful Get Heap requests:   129-  136                 59762 
  Successful Get Heap requests:   137-  144                 43744 
  Successful Get Heap requests:   145-  152                 17307 
  Successful Get Heap requests:   153-  160                 28673
Pool  3     size:   288 Get Requests:            65642  

I used ISPF edit, to process the report.

By extracting the records with size: you get the count of requests per pool.

Pool  1     size:    80 Get Requests:           462187 
Pool  2     size:   160 Get Requests:           777707 
Pool  3     size:   288 Get Requests:            65642 
Pool  4     size:   792 Get Requests:            18293 
Pool  5     size:  1520 Get Requests:            23861 
Pool  6     size:  2728 Get Requests:            11677 
Pool  7     size:  4400 Get Requests:            48943 
Pool  8     size:  8360 Get Requests:            18646 
Pool  9     size: 14376 Get Requests:             1916 
Pool 10     size: 24120 Get Requests:             1961 
Pool 11     size: 37880 Get Requests:             4833 
Pool 12     size: 65536 Get Requests:              716 
Requests greater than the largest cell size:               1652 

It might be worth splitting Pool 2 and seeing if makes a difference in CPU usage at peak time. If it has a benefit, try Pool 1.

You can also sort the “Successful Heap requests” count, and see what range has the most requests. I don’t know what you would use this information for, unless you were investigating why so much storage was being used.

Ph D level for heap

For high use application on boxes with many CPUs you can get contention for storage at the hardware cache level.

Before a CPU can use storage, it has to get the 256 byte cache line into the processor cache. If two CPU’s are fighting for storage in the same 256 bytes the throughput goes down.

By specifying

HEAPP(ALIGN….

It ensures each block is isolated in its own cache line. This can lead to an increase in virtual storage, but you should get improved throughput at the high end. It may make very little difference when there is little load, or on an LPAR with few engines.