I hit these messages when doing some Java work. Ive added more information to the messages. I expect people will only get to this page from a web search.
EDC messages
EDC5129I No such file or directory.
Also ENOENT error code 129.
This is not strictly true. When using semget() this code means the userid does not have access to it. Perhaps EACCESS code would have been better.
Java shared classes.
JVMSHRC336E Port layer error code = …
For example JVMSHRC336E Port layer error code = -197360. -197360 is 0xfffC FD10
From the first half word you can tell the external function which caused the problem
FTOK   FFFD
SEMGET FFFC
SEMCTL FFFB
SEMOP  FFFA
SHMGET FFF9
SHMCTL FFF8
SHMAT  FFF7
SHMDT  FFF6
GETIPC FFF5
See here for the code saying…
- EACCESS FD12 -Permission is denied.
- EEXIST FD11 -The file exists.
- ENOENT FD10 – No such file, directory, or IPC member exists.
- EINVAL FD0F – The parameter is incorrect.
- ENOMEM FD0E – Not enough space is available (I think this means virtual storage).
- ENOSPC FD0D -No space is left on the device, or no space is available to create the IPC member ID.
- ELOOP FD0C – A loop is encountered in symbolic links.
- ENAMETOOLONG FD0B – The file name is too long.
- ENOTDIR FD0A – Not a directory.
- EPERM FD09 -The operation is not permitted.
- ERANGE FD08 -Result is too large.
- E2BIG FD07 – The parameter list is too long, or the message to receive was too large for the buffer.
- EAGAIN FD06 – The resource is temporarily unavailable.
- EFBIG FD05 – The file is too large.
- EIDRM FD04 – Identifier removed.
- EINTR FD03 – A function call is interrupted.
- EMFILE FD02 – Too many files are open for this process.
So JVMSHRC336E Port layer error code = -197360 is 0xfffC FD10 which is SEMGET ENOENT .
One’s I have hit
- -197359 is 0xfffC FD11 which is SEMGET EEXIST -The file exists.
- -197360 is 0xfffC FD10 which is SEMGET ENOENT – No such file, directory, or IPC member exists.
- –262894 is 0xfffb FD12 which is SEMCTL EACCESS – Permission denied.
- -328433 is 0fffa FD0F which is SEMOP – The parameter is incorrect.
- -393968 is 0xfff9 fd10 which is SHMGET EPERM -The operation is not permitted.
- -459502 is 0xfff8 FD12 which SHMCTL EACCESS -Permission is denied.
JVMSHRC337E Platform error message: EDC5132I Not enough memory. (errno2=0x072B06AB)
The errno 072b06ab says
JRMmapMaxShareFail: A map request is attempted but the total share pages exceeds the MAXSHARE limit
Action: Ensure mmap usage does not exceed MAXSHARE limits.
You need to ensure that your system has the SMFLIMxx parmlib updates. This is a requirement for the ibmjava:8 container image in order to support caches mapped above the 2 GB address range. The maximum size of these caches are limited by the MAXSHARE value within the SMFLIMxx PARMLIB member.
Issue
D SMFLIM
to see what limits you have defined.
I had NO SMF LIMITS ARE IN EFFECT.
JVMSHRC020E An error has occurred while opening semaphore
JVMSHRC336E Port layer error code = -262894
JVMSHRC337E Platform error message: semctl : EDC5111I Permission denied. (errno2=0x070E0303)
JVMSHRC028E Permission Denied
JVMSHRC840E Failed to start up the shared cache.
JVMJ9VM015W Initialization error for library j9shr29(11): JVMJ9VM009E J9VMDllMain failed
Error: Could not create the Java Virtual Machine
-262894 is SEMCTL EACCESS – Permission denied.
The owner of the shared file cache was not the userid trying to use it.
chown ZWESVUSR:SYS1 *
Changed the files, such as
ZWESVUSR SYS1     314572800 Feb  9 08:43 C290M17F1A64S_zoweGW_G43L00
ZWESVUSR SYS1          32 Feb 10 06:35 C290M17F1A64_semaphore_zoweGW_G43L00
ZWESVUSR SYS1          40 Feb 10 06:35 C290M17F1A64_memory_zoweGW_G43L00
JVMSHRC020E An error has occurred while opening semaphore
JVMSHRC336E Port layer error code = -197360
JVMSHRC337E Platform error message: semget : EDC5129I No such file or directory.
-197360 is SEMGET ENOENT – No such file, directory, or IPC member exists.
I got these trying to restore a sharedclasses cache, when I did not have access to the file.
/usr/lpp/java/J17.0_64/bin/java -Xshareclasses:cacheDir=/u/tmp/zowec,name=zoweGW,restoreFromSnapshot
I gave the userid access and it worked
chmod 777 /u/tmp/zowec/javasharedresources/*
JVMSHRC659E An error has occurred while opening shared memory
JVMSHRC336E Port layer error code = -459502
JVMSHRC337E Platform error message: shmctl : EDC5111I Permission denied.
JVMSHRC028E Permission Denied
JVMSHRC626I The stats of the shared cache cannot be obtained since a valid shared cache does not exist.
JVMJ9VM015W Initialization error for library j9shr29(11): JVMJ9VM009E J9VMDllMain failed
-459502 is SHMCTL EACCESS -Permission is denied.
The userid issuing the command does not have access to the resource.
The documentation says the shared class cache is created with ONLY USER read/write access by default unless the groupAccess command-line suboption is used, in which case the access is read/write for user and groups.
Note: Users with super user authority gid=0(SYS1) can issue the command with no additional authority.
To find the group list the directories containing the cache, for example if /var/zosmf/data/logs/.classCache/ was specified use ls -ltr /var/zosmf/data/logs/.classCache/javasharedresources.
For me it had owner IZUSVR group IZUADMIN.
I used the RACF command connect COLIN group(IZUADMIN) to connect the userid to the group. Even then the command failed, because groupAccess had not been defined on the -Xshareclasses… parameter. I had to delete the cache so it was recreated next time theJVM started. Then the java -Xshareclasses:cacheDir=/var/zosmf/data/logs/.classCache,name=liberty-IZUSVR,verbose,printStats worked.
JVMSHRC023E Cache does not exist
I had
-Xshareclasses:cacheDir=/javasc,name=izusvr1cache,printStats
I had to remove the printStats.
JVMSHRC364E SH_OSCachesysv::acquireWriteLock() call to j9shsem_wait on semid … has failed with error -328433.
-328433 is SEMOP – The parameter is incorrect.
You can use the ipcs Unix commands to display the semaphore ids.
JVMSHRC005I No shared class caches available
I was using
/usr/lpp/java/J11.0_64/bin/java -Xshareclasses:cacheDir=/global/zosmf/data/logs/.classCache/,verbose,listAllCaches
to display information about shared cache usage, and kept getting the JVMSHRC005I No shared class caches available message. I experienced two reasons for this.
- The information in the file, was for last week’s IPL, and the the information in today’s memory was invalid.
- I was using the wrong level of Java. Once I used the right level of Java it worked!
restoreFromSnapshot
IBMUSER:/u/ibmuser: >cd /u/tmp/zowec
IBMUSER:/u/tmp/zowec: >/usr/lpp/java/J17.0_64/bin/java -Xshareclasses:cacheDir=/u/tmp/zowec,name=zoweGW,restoreFromSnapshot
JVMSHRC020E An error has occurred while opening semaphore
JVMSHRC336E Port layer error code = -197360
JVMSHRC337E Platform error message: semget : EDC5129I No such file or directory.
JVMSHRC727E An error has occurred in creating the new non-persistent shared cache
JVMSHRC808I Compressed references shared cache “zoweGW” is destroyed. Use option -Xnocompressedrefs if you want to destroy a non-com pressed references cache.
JVMSHRC699E Failed to restore the non-persistent shared cache “zoweGW” from the snapshot
This may be connected to the the following
The following files were in the directory
-rw-r--r-- 1 ZWESVUSR ZWEADMIN ... C290M17F1A64_semaphore_zoweGW_G43L00
-rw-r--r-- 1 ZWESVUSR ZWEADMIN ... C290M17F1A64_memory_zoweGW_G43L00
For example the above files were had owner: ZWESVUSR group: ZWEADMIN.
The userid was in group ZWEADMIN, and so does not get R/W access to the files.
Errno2
- 0x071D0303: JRIpcDenied: Access was denied because the caller does not have the correct permission.
- 0x053b006c: JRFileNotThere: The requested file does not exist
- 0x0594003d: JRDirNotFound: A directory in the pathname was not found
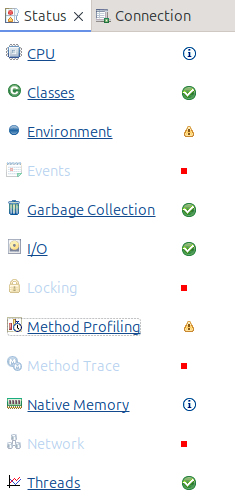
Java Health center messages
Health center Non IBM version of Java Health Center client
I got this when connecting the Health Center on Eclipse to a Liberty server. I think the message really means, unable to connect to the port.
The TSO command tso netstat allconn did not show it was active.