Did you read the sentence just once? The work of words – the PEE test.

I was investigating purchasing something expensive like a car, and found a web site which was hard to read.  The long forgotten words of my English teacher from over 50 years ago came into my mind.

For a well written document,

  1. every sentence should be read just once
  2. it should be easy for the reader

For example words on a web page for selling a new car

  1. The Supervandex model-95 has twin cam, 16 valve supercharged petrol engine with a vanadium gismo, has a 16 speaker all round system.  It has 2 seats and enough space for some small suitcases, and looks really cool.
  2. The Supervandex model-96 has single cam, 8 valve supercharged petrol engine with a vanadium gismo, has a 8 speaker all round system.  It has 4 seats and enough space for some small suitcases, a dog and a set of golf clubs.  This is a practical car.

What is wrong with those statements?

For the car sales person this is very clear as he or she needs to know the details of each model.  For the average punter like me, who wants a petrol car  with space for 2 dogs and my mother’s walking frame; the sentences are hard to read and require a lot of work. My thoughts would be

  1. “Supervandex-95 … blah blah Petrol – that’s good’… what model ? (reread the sentence) the Supervandex-95 blah blah blah… 2 seats – that’s no good for me”
  2. “Supervandex-96 … blah blah Petrol – that’s good’… what model ? (reread the sentence) the Supervandex-96 blah blah blah… 4 seats – and it looks like a big enough boot.  Supervandex 96 sounds like the one I need”

I had to read parts of each sentence more than once, and had to keep information in my short term memory, and then forget it when it was no longer needed.

For someone wanting to buy a car (and did not care what the model number was), I think the following would be clearer.

  1. The two seater petrol car with space for a couple of suitcases (The Supervandex-95) has twin cam, 16 valve supercharged petrol engine with a vanadium gismo, has a 16 speaker all round system.
  2. The four seater petrol car  with enough space for some small suitcases, a dog and a set of golf clubs (the Supervandex-96) has single cam, 8 valve supercharged petrol engine with a vanadium gismo, has a 8 speaker all round system.

Now, my thoughts are

  1. “Two seater… not big enough I’ll skip the rest of the sentence and go to the next item
  2. “Four seater, and enough space in the boot, this looks interesting.   The Supervandex-96… boring boring boring.   So it is the Supervandex 96 for me”

I did not have to read the whole of the first sentence, and from the second sentence I could quickly see that it met my requirements.  I only had to remember Supervandex-96.

For me the second text was better than the first text.

There is the automated readability index = 4.71 *( number of characters/number of words) + 0.5* (number of words/number of sentences) – 21.43.  A score of 1 is for kindergarten, a score of 14+ is Professors.

We could have the PEE test – the Paice’s Eyeball Energy test – compare texts by monitoring the movement of the eyeball, and work out the energy in micro-joules for each text. Every time the eye had to go back it would take energy to stop the eyeball, go back, and reread the text.  ( Of course you would have to have a standard eyeball mass, and the text read from a fixed distance, so the energy to move the eyeball is the same – nothing insurmountable.)

We could take this further and take an electroencephalogram (EEG – a swimming cap with lots of electrodes detecting brain activity), and see how much electrical activity was generated when trying to parse statements.   I remember being in China, when someone from the UK was trying to explain something to the Chinese managers (who could understand English – but not speak it), using one very long statement; many ifs, and whethers, and depending ons.  My short term memory overflowed, and I was writing down what the person was saying.    The amount of electrical energy I used to parse and process the nested conditional text would have powered a light bulb!  I pitied the poor Chinese who ignored the statement and then said “thank you, our next question is …”. 

I had a mentor who said before you send an email or go into a meeting, ask yourself “why are you telling your audience this information?” is it

  1. just for information
  2. for action
  3. it is such good news – Ive got to tell every one

then in the meeting tell them “I am telling you this because … you need to take an action”, or “for information”.    If it is for information only, then they can only half listen.  If they need to take action, for example spend money, they will give it their full attention.

Why am I telling you about the PEE test?

When you write emails of documents you need to understand who your audience is, and what they want out of the information. People should be able to read the information without going back and rereading it.

Am I going to buy the Supervandex-96 model ?  I don’t know  – they only gave the price of the Supervandex-95 model. This goes to show a low PEE value is not the perfect solution.


Why cant I logoff from mqconsole?

If you are using mqweb using certificates to identify yourself, if you logoff, or close the tab, then open a new tab, you will get a session using the same certificate as before.

This little problem has been a tough one to investigate, and turns out to be lack of function in Chromium browser.

The scenario is you connect to mqweb using a digital certificate. You want to logoff and logon again with a different certificate, for example you do most of your work with a read only userid, and want to logon with a more powerful id to make a change.  You click logoff, and your screen flashes and logs you on again with the same userid as before.

At first glance this may look like a security hole, but if someone has access to your web browser, then the can click on the mqweb site, and just pick a certificate – so it is no different.

Under the covers,  the TLS handshake can pass up the previous session ID.   If the server  recognises this, then it is a short handshake instead of a full hand shake, so helping performance.

To reset the certificate if you are using Firefox

To clear your SSL session state in Firefox choose History -> Clear Recent History… and then select “Active Logins” and click “OK”. Then the next time you connect to your SSL server Firefox will prompt for which certificate to use, you may need to reset the URL.

You should check Firefox preferences, certificates, “Ask you every time” is selected, rather than “Select one automatically”.

Chrome does not support this reset of the certificate.

There has been discussion over the last 9 years along the lines of, seeing as Internet Explorer, and Firefox have there, should we do it to met the end user demand?

If you set up an additional browser instance, you get the same problem. With Chrome you have to close down all instances of the browser and restart chrome to be able to select a different certificate.

It looks like there is code which has a cache of url, and certificate to use.   If you open up another tab using the same IP address you will reuse the same certificate.

If you localhost instead of 127.0.0.1 – it will prompt for certificate, and then cache it, so you can have one tab open with one certificate, and another tab, with a different URL and another certificate.
GUIs ain’t what they used to be

I’ve recently had to use some “improved” applications (one of which was internet banking) and it made me realize how different GUIs are these days compared to when I were a lad, and you only had a choice of text colours green or bright green.  (I remember a banking customer being shown the pre-release 3279 displays which could display 8 colours.  The customer asked “why do we need so many colours”, and someone said “you can show overdrawn balances in red” – the banker was convinced; and put in a big order).

You need to know your audience for example

  1. People who only use the app once a week, for example internet banking.   You want the user to do things easily and without problems. They may just want to look at the top few entries in their bank statement
  2. People who use the interface 100 times a day – for example, programmers and administrators.  These people want to do their job – and one key press is better than multiple key-presses.  They need to process large  numbers of items(hundreds) and take actions.

I feel that modern interfaces try to use one interface for both sets of users.

As a professional programmer I wanted any interface to be efficient.  For example

  • small movements – press just one key if possible
  • have important fields together.   For example for a list of left justified items, have the action field/icon in front of the list instead of at  the right hand side, being the wrong end of the line.  They eye should only have small movements.
  • display “more” – with one key press
  • use screen space efficiently

I thought the ISPF interface on z/OS was very good.

  • I could efficiently move around it, for example, when looking at job output, I could type =L;3;4;(enter) to get to the place in the GUI hierarchy to list the files.
  • You press F7 andF8 to scroll within the file
  • You have a local command area in front of each item in a list and you can use E to edit, B for Browse, D for delete etc.
  • You can have thousands of entries in the list, and can you the “find” command to locate entries of interest.
  • I can could organise fields in the display, so I can display the start of job/file/queue name, and %cpu/depth/depth and so the important information was in the left 20 %of the screen – and then stack up 4 screens from different systems all showing this information.

Compare this with “the modern GUI” in a web browser

  • Often you have a big picture or icon at the top of the screen – wasting valuable space.   The first thing you have to do is scroll past it. To get to the top you press “home” and “page down” – two key strokes
  • Lines are widely spaced – for example one row of output per centimeter of screen space, showing 10 lines per window, a third the density compared to the mainframe
  • “Actions” icons are at the right hand end of the lines – it is harder to match up the line of interest with the action icon – coloured backgrounds help with this.  Sometimes the “Action icon” is off the side of the screen – so is invisible.  It would help to have an action icon at each end to make it easier.   (I remember a “new” tool in IBM that we had to use, which had the “save” button off the side of the screen.  It was only visible if the window was very wide.   I lost a lot of data as I foolishly assumed the lack of a visible “save” button meant the tool saved automatically! – and pressing the “help” button lost what you had typed.)   The minimum you want displayed is the item, and the action.  Having the action icon only at the right means you will lose it if you make the window narrower.
  • Can we have “right click” for data rows?
  • I tend to work with a “messy desk” with several narrow windows displayed, many on automatic refresh.   This allows me to quickly see if things have changed.   If I am forced to have wide windows, then I need an even wider display which is less efficient
  • You have to click on “Next” and “Back” to navigate.  Some times “Up” is at the top of the screen, and “Down” is at the bottom of the screen so you have to move your mouse a large distance to be able to scroll.  Having up and down buttons adjacent,  is much more efficient as  it means you need a small movement to be able to scroll.
    • Some times the “next” or “back” button move as you move through the pages.  This means you have to move the mouse, and so slows you down!
  • It displays a small number of items at a time  (up to 50) to display more, you have have to scroll – for example I have 500 user queues on one of my queue managers – that would be 10 “next page” actions to get to the end.  Personally I would allow up to 1000 items on the page.

I remember watching some Chinese programmers who could drive their systems properly by chaining all of the commands together and they could type faster than the eye could follow.

Ive seen other people who program their 3270 emulator so Alt+Ctrl+6 logged on to another system, issued commands, copied data to a clip board, jumped to another session and pasted the data in a file.  This was a joy to watch.

Ive seen other people who use the cursor to scroll up and down a web page to get to the bottom, to find the “next” key, and it takes them 10 seconds a page.  I did not show my frustrations but suggested they use the “home” and “end” keys – for which they were very grateful.

On my laptop I use  Ctrl+up instead of the home key and Ctrl+down instead of the end key, as my hands to not need to move so far, which means it is more accurate.   I doubt if modern web GUI designers think about this sort of design.

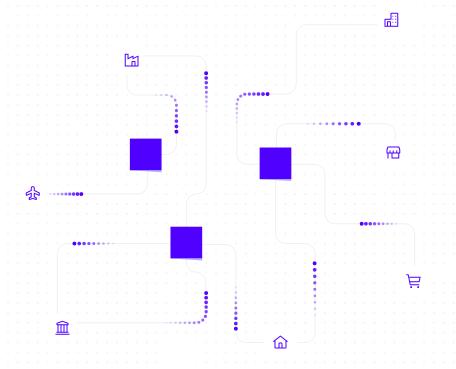
What is the connection between MQ, a thatched cottage, a museum, an aeroplane and a factory?

Do you give up on the question – so do I!

I upgraded to 915 and used the “improved” mqconsole web interface.  This has several problems. Under “MQ Basics, what is messaging?” you get some pictures.  For example, we seem to have random meteors going to random places,

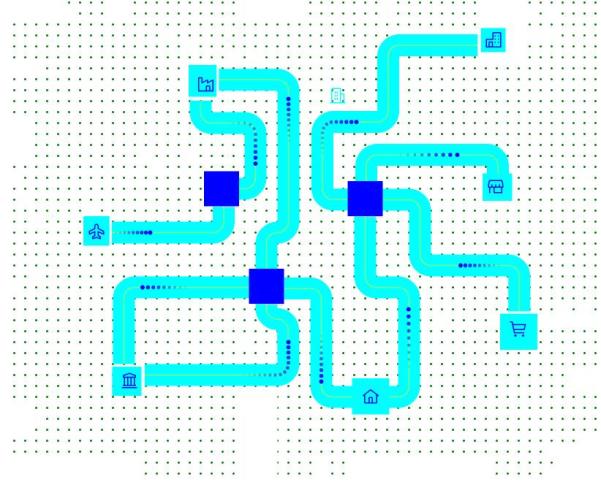
It is hard to understand, as it uses a white background and off-white colours for connections.   I took the source of this, and by a bit of python magic changed the html and produced

This is clearer, but I am non the wiser.  We have  icons for Home,  Shopping Trolley, Thatched cottage, High rise building with garage, Factory, Aeroplane, and Museum.  The aeroplane sends stuff to the blue box( queue manager?) but messages are not processed.

My blog posts from the old IBM community

The old IBM community site is being replaced by a new IBM community web site, and old blogs are not being copied across.

I’ve managed to copy the posts I wrote when I worked for IBM and copied them to this web site. It has been a trip down memory lane reading the posts, and the topic I covered.

NETTIME does not just mean net time

I saw a post which mentioned NETTIME and where people assume it is the network time.   It is more subtle than that.

If NETTIME is small then dont worry.   If NETTIME is large it can mean

  • Slow network times
  • Problems processing messages at the remote end

Consider a well behaved channel where there are 2 messages on the transmission queue

Sender end Receiver end
  • MQGET first message from the queue
  • TCP Send message in  buffer 1
  • MQGET second message from the queue
  • TCP Send message in buffer 2
  • MQGET – no message found
  • Do end of batch processing
    • TCP Send “End of batch” in buffer 3
    • Start timer
    • Wait
    • buffer arrives, wake up application
    • Stop timer. Interval is “Sender wait time”
  • Extract “receiver processing time” from reply buffer
  • Calculate NETTIME = “sender wait time” – “receiver processing time”
  • buffer 1 arrives, wake up Receiver channel application
  • buffer 2 arrives
  • TCP receive buffer 1 from network
  • MQPUT message 1 to the queue
  • buffer 3 arrives
  • TCP receive buffer 2 from network
  • MQPUT message 2  to the queue
  • TCP receive buffer 3 from the network – get  “end of batch” flag
    • Start timer
    • Issue commit
    • Stop timer
    • Send “OK + time interval back to Sender

In this case the NETTIME is the total time less the time at the receiver end.  So NETTIME is the network time.

In round numbers

  • it takes 2 millisecond from sending the data to it being received
  • get + send takes 0 ms ( the duration of these calls is measured in microseconds)
  • receive (when there is data) + MQPUT and put works, takes 0 ms
  • commit takes 10 ms
  • it takes 1 ms between sending the response and it arriving.
  • “10 ms” is sent in the response message

This is a simplified picture with details omitted.

The sender channel sees 13 ms  between the last send and getting the response.  (13 ms – 10 m)s is 3 ms – the time spent in the network.


Now introduce a queue full situation at the receiver end

Sender end Receiver end
  • MQGET first message from the queue
  • TCP Send message in buffer 1
  • MQGET second message from the queue
  • TCP Send message in buffer 2
  • MQGET – no message found
  • Do end of batch processing
    • TCP Send “End of batch” in buffer 3
    • Start timer
    • Wait
    • buffer arrives, wake up application
    • Stop timer. Interval is “Sender wait time”
  • Extract “receiver processing time” from reply buffer
  • Calculate NETTIME = “sender wait time” – “receiver processing time”
  • buffer 1 arrives, wake up Receiver channel application
  • buffer 2 arrives
  • TCP receive buffer 1 from network
  • MQPUT message 1 to the queue – it gets queue full, it pauses
  • buffer 3 arrives.  All of the data is in the buffers in TCP at this end.
  • after 500 ms the MQPUT succeeds.
  • TCP receive buffer 2 from network
  • MQPUT message 2 to the queue
  • TCP receive buffer 3 from the network – get “end of batch” flag
    • Start timer
    • Issue commit
    • Stop timer
    • Send “OK + time interval back to Sender

In round numbers

  • it takes 2 millisecond from sending the data to it being received
  • get + send takes 0 ms ( it is in microseconds)
  • receive (when there is data) takes 0 ms
  • the pause and retry took 500 ms
  • the second receive and MQPUT takes 0 ms
  • commit takes 10 ms
  • it takes 1 ms between sending the response and it arriving.
  • “10 ms” is sent ( as before) in the response message (the time between the channel code seeing the “end of batch” flag and the end of its processing
  • Buffer 3 with the “end of batch” flag was sitting in the TCP buffers for 500 ms

The sender channel sees 513 ms  between the last send and getting the response.  513 ms – 10 ms is 503  ms – and reports this as ” the time spent in the network” when in fact the network time was 3 ms, and 500 ms was spent wait to put the message.

Regardless of the root cause of the problem, a large nettime should be investigated:

  • do a TCP ping to do a quick check of the network
  • check the error logs at the receiver end
  • check events etc to see if the queues are filling up at the receiver end

The ccdt file was exactly where I specified it.

I had been successfully using a json ccdt file to use runmqsc as a client.  Because of a “.” it didn’t work when I used it elsewhere.

I had a directory of useful shell scripts.  In this directory I had my mqclient.ini with

CHANNELS:
MQReconnectTimeout=30
ReconDelay=(1000,200)(2000,200)(4000,1000)
ChannelDefinitionDirectory=.
ChannelDefinitionFile=ccdt.json

I had another directory with some shell scripts for some other applications.  I used

export MQCLNTCF=/home/colinpaice/… to point to the mqclient.ini file.

When I used runmqsc -c QMA I got

AMQ8118E: IBM MQ queue manager does not exist.

In /var/mqm/errors/AMQERR01.LOG was the error message AMQ9518E: File ‘./ccdt.json’ not found.

This was because I had specified ChannelDefinitionDirectory=. instead of a fully qualified name.  I had wrongly assumed that “.” meant the same directory as the mqclient.ini file.

The moral of this user error is to

  • use a fully qualified directory instead of “.”
  • or omit this parameter, and put the ccdt.json in the default location /var/mqm – but you may not have write access to this directory.
  • and go to the bottom of the class.

Do not panic so much if you are still running MQ V8

I had a question from a customer about being unable to use the REST API because they were still on MQ V8.

The announced end of support date for V8 was the end of April 2020. This gives them no time to upgrade test system, pre-production, and production.

Do not panic if you haven’t  upgraded yet – because the page says

This gives you a bit of time to get to MQ 9.1 – dont delay, raise a change request today.

Using Activity Trace to show a picture of which queues and queue managers your application used.

I used the midrange MQ activity trace to show what my simple application, putting a request to a cluster server queue and getting the reply, was doing.  As a proof of concept (200 lines of Python), I  produced the following

This output is a .png format.   You can create it as an HTML image, and have the nodes and links as clickable html links.

Ive ignored any SYSTEM.* queues, so the SYSTEM.CLUSTER.TRANSMIT.QUEUE does not appear.

The red arrows show the “high level” flow between queue managers at the “architectural”, hand waving level.

  • The application oemput on QMA did a put to a clustered queue CSERVER, there is an instance of the queue on QMB and QMC.   There is a red line from QMA.oemput to the queue CSERVER on QMB and QMC
  • The server programs, server running on QMB and QMC put the reply message to queue CP0000 on queue manager A

The blue arrows show puts to the application specified queue name – even though this may map to the S.C.T.Q.  There are two blue lines from QMA.oemput because one message went to QMC.CSERVER, and another went to QMB.CSERVER

The yellow lines show the path the message took between queue managers.  The message was put by QMA.oemput to queue CSERVER; under the covers this was put to the SCTQ.  From the accounting trace record this shows the remote queue manager and queue name:  the the yellow line links them.

The black line is getting from the local queue

The green line is the get from the underlying queue.  So if I had a reply queue called CP0000, with a QAlias of QAREPLY. If the application does a get from QAREPLY,  There would be a black line to CP0000, and a green line to QAREPLY

How did I get this?

I used the midrange activity trace.

On QMA I had in mqat.ini

applicationTrace:
ApplClass=USER # Application type
ApplName=oemp* # Application name (may be wildcarded)
Trace=ON # Activity trace switch for application
ActivityInterval=30 # Time interval between trace messages
ActivityCount=10 # Number of operations between trace msgs
TraceLevel=MEDIUM  # Amount of data traced for each operation
TraceMessageData=0 # Amount of message data traced

I turned on the activity trace using the runmqsc command

ALTER QMGR ACTVTRC(ON)

I ran some work load, and turned the trace off few seconds later.

I processed the trace data into a json file using

/opt/mqm/samp/bin/amqsevt -m QMA -q SYSTEM.ADMIN.TRACE.ACTIVITY.QUEUE -w 1 -o json > aa.json

I captured the trace on QMB, then on QMC, so I had three files aa.json, bb.json, cc.json.  Although I captured these at different times, I could have collected them all at the same time.

jq is a “sed” like processor for processing json data.   I used it to process these json files and produce one output file which the Python json support can handle.

jq . --slurp aa.json bb.json cc.json  > all.json

The two small python files are zipped here. AT.

I used ATJson.py python script to process the all.json file and extract out key data in the following format:

server,COLIN,127.0.0.1,QMC,Put1,CP0000,SYSTEM.CLUSTER.TRANSMIT.QUEUE,QMC,CP0000,QMA, 400

  • server, the name of the application program
  • COLIN, the channel name, or “Local”
  • 127.0.0.1, the IP address, or “Local”
  • QMC, on this queue manager
  • Put1, the verb
  • CP0000, the name of the object used by the application
  • SYSTEM.CLUSTER.TRANSMIT.QUEUE, the queue actually used, under the covers
  • QMC, which queue manager is the SCTQ on
  • CP0000, the destination (remote) queue name
  • QMA, the destination queue manager
  • 400 the number of times this was used, so 400 puts to this queue.

I had another python program Process.py which took this table and used python graphviz to draw the graph of the contents.  This produces a file with DOT  (graph descriptor language)parameters, and used one of the many programs to draw the chart.

This shows you what can be done, it is not a turn-key solution, but I am willing to spend a bit of time making it easier to use, so you can automate it.  If so please send me your Activity Trace data, and I’ll see what I can do.

My mid-range accounting is missing data

Like many of the questions I get asked, it started off as a simple question.

Over a day, what people and machines are using this queue?”  Simple I said.  Just use the accounting data.

Problem 1

I had a program which puts a message to a clustered queue on a remote queue manager.  The message flows to the server and a reply is sent back.  I thought I would check it works.  No it didn’t.

The accounting data has my program, but it recorded a message put to the SYSTEM.CLUSTER.TRANSMIT.QUEUE, and a message got from my reply queue, so I cannot tell what queue was used, but I can tell how many bytes were processed

Problem 2

My application doing just a publish did not show up in the accounting data.

I used the samples amqspub, and amqssub to publish, and subscribe respectively.

The accounting data had a record for the amqssub, getting from a queue, but there was no record for the publishing application.

As Morag kindly pointed out, you can tell how many publishes you did from the MQI accounting data, but not to which topic.

Ive started looking at the activity trace, but this looks like a heavyweight solution to the simple question.

Problem 3

Someone else pointed out that if you want to know the channel name, and IP address of the application using a queue, you have to do some extra work.

  • Collect the MQI accounting
  • Process queue accounting and MQI accounting, and use the common field connectionId to merge the data

Using amqsevt to display the accounting data in json format you get

“eventData” : {
“queueMgrName” : “QMC”,
“startDate” : “2020-04-17”,
“startTime” : “09.43.23”,
“endDate” : “2020-04-17”,
“endTime” : “10.18.58”,
“commandLevel” : 913,
“connectionId” : “414D5143514D432020202020202020201361995E0A24A923”,
“sequenceNumber” : 1,
“applName” : “server”,
“processId” : 29103,
“threadId” : 11,
“userIdentifier” : “colinpaice”,
   “connDate” : “2020-04-17”,
   “connTime” : “09.12.16”,
   “connectionName” : “127.0.0.1”,
   “channelName” : “COLIN”,

Where the bold text is for the data only in the MQI accounting information.

It looks like the MQI accounting record is produced before the Queue accounting record.

You will need to save the connectionId key with the connection specific information.  When the queue accounting record is processed, use the connectionId to look up the information and append it to the queue record.  If many queues are being used, you may get multiple queue accounting records – so you cannot simply delete the connection key and connection specific information.