Tracing encrypted data to z/OS

I had blogged Collecting a wire-shark trace with TLS active for a browser where you could specify an environment variable export SSLKEYLOGFILE=$HOME/sslkeylog.log. OpenSSL would write the key to this file, and Wireshark could decrypt the traffic using this data.

Unfortunately this only worked with RSA keys. I could not get it to work with modern Elliptic Curve keys.

I’ve updated my zWireshark program to capture AT-TLS application data in clear text from the z/OS side. It uses an IBM provided API, and captures the traffic between AT-TLS and the application.

You need to set up security profiles, for example

permit  EZB.TRCSEC.*.*.ATTLS            - 
CL(SERVAUTH) id(ADCDB) access(READ)
permit EZB.TRCCTL.S0W1.TCPIP.DATTRACE -
CL(SERVAUTH) id(ADCDB) access(READ)
permit EZB.TRCCTL.S0W1.TCPIP.OPEN -
CL(SERVAUTH) id(ADCDB) access(READ)
permit EZB.TRCCTL.*.*.* CL(SERVAUTH) id(ADCDB) access(READ)
SETROPTS RACLIST(SERVAUTH) refresh

and change the AT-TLS configuration to include CtraceClearText On

For my web browser traffic it produced (printed with the ASCII switch)

Data trace.  Data length 345.  ATTLS Clear Text.                             
<GPMSERVE 11:01:57.258946 Src 10.1.1.2 Port 8803 Dst 10.1.0.2 Port 45168
Warning: 199 RMF-DDS-Server SeverityCode(03) Data(0)
Content-Location: perform_20250102110157_20250102110157.xml
Cache-Control: max-age=30
Date: Thu, 02 Jan 2025 11:01:57 GMT
Connection: close
Content-Length: 1468
Content-Type: application/xml
X-UA-Compatible: IE=edge
X-Content-Type-Options: nosniff
X-XSS-Protection: 1; mode=block

When the AT-TLS option CtraceClearText was Off, the output was

Data trace.  Data length 0.  PTH_Flag.Confidential.                           
<GPMSERVE 11:27:48.733616 Src 10.1.1.2 Port 8803 Dst 10.1.0.2 Port 52860

So no confidential data was displayed.

The JCL is

//COLINC5    JOB 1,MSGCLASS=H,COND=(4,LE) 
// SET LOADLIB=COLIN.ZWIRESHA.LOAD
//RUN EXEC PGM=TCPDATA,REGION=0M,PARMDD=MYPARMS
//STEPLIB DD DISP=SHR,DSN=&LOADLIB
//SYSPRINT DD SYSOUT=*,DCB=(LRECL=200)
//SYSOUT DD SYSOUT=*
//SYSERR DD SYSOUT=*
//* MYPARMS needs a / to split LE parms from program parms
//* needs a blank before each parm, because trailing blanks removed
//MYPARMS DD *
/
--IP 10.1.0.2
--WAIT 60
--DEBUG 0
--DISCARD 1
--PRINT A
/*

Please let me know of any problems or suggestions

Destination unreachable, Port unreachable. Which firewall rule is blocking me?

I was trying to connect an application on z/OS through a server to my laptop – so three systems involved.

On the connection from the server to my laptop, using Wireshark I could see no traffic from the application.

When I used Wireshark on the z/OS to server connection I got

   Source   Destination port Protocol info 
>1 10.1.1.2 10.1.0.2 2175 TCP ..
<2 10.1.1.1 10.1.1.2 2175 ICMP Destination unreachable (Port unreachable)

This means

  1. There was a TCP/IP Packet from 10.1.1.2 (z/OS) to 10.1.0.2 (mylaptop) port 2175
  2. Response:Destination unreachable (Port unreachable)

This was a surprise because I could ping from z/OS through the server to the laptop.

Looking in the firewall log ( /var/log/ufw.log) I found

[UFW BLOCK] IN=tap0 OUT=eno1 MAC=... SRC=10.1.1.2 DST=10.1.0.2 ... PROTO=TCP SPT=1050 DPT=2175 ...

This says

  • Packet was blocked. When using the ufw firewall – all of its messages and definitions contain ufw.
  • From 10.1.1.2
  • To 10.1.0.2
  • Source port 1050
  • Destination port 2175

With the command

sudo ufw route allow in on tap0 out on eno1

This allows traffic to be routed through this node from interface tap0 to interface eno1, and solved my problem.

What caused the problem?

iptables allows the systems administrator to define rules (or chains of rules – think subroutines) to control the flow of packets through the Linux kernel. For example

  • control input input packets destined for this system
  • control output packets from this system
  • control forwarded packets flowing through this system.

ufw is an interface to iptables which makes it easier to define rules.

You can use

sudo ufw status

to display the ufw definitions, for example

To                         Action      From
-- ------ ----
22/tcp ALLOW Anywhere
Anywhere on eno1 ALLOW Anywhere
Anywhere on tap0 ALLOW Anywhere (log) # ‘colin-ethernet’

You can use

sudo iptables -L -v

to display the iptables. The -v options show you how many times the rules have been used.

sudo iptables-save reports on all of the rules. For example (a very small subset of my rules)

-A FORWARD -j ufw-before-forward
-A ufw-before-forward -j ufw-user-forward
-A ufw-user-forward -i tap0 -o eno1 -j ACCEPT
-A ufw-user-forward -i eno1 -o tap0 -j ACCEPT

-A ufw-skip-to-policy-forward -j REJECT --reject-with icmp-port-unreachable

Where

  • -A FORWARD.… says when doing forwarding use the rule (subroutine) called ufw-before-forward. You can have many of these statements
  • -A ufw-before-forward -j ufw-user-forward add to the end of subroutine ufw-before-forward, call (-jump to) subroutine ufw-user-forward
  • -A ufw-user-forward -i tap0 -o eno1 -j ACCEPT in subroutine ufw-user-forward, if the input interface is tap0, and the output interface is eno1, then ACCEPT the traffic, and pass it on to interface eno1.
  • -A ufw-user-forward -i eno1 -o tap0 -j ACCEPT in subroutine ufw-user-forward, if the input interface is eno1, and the output interface is tap0, then ACCEPT the traffic, and pass it on to interface eno1.
  • -A ufw-skip-to-policy-forward -j REJECT –reject-with icmp-port-unreachable. In this subroutine do not allow the packet to pass through, but send back a response icmp-port-unreachable. This is the response I saw in Wireshark.

With -j REJECT you can specify

icmp-net-unreachable
icmp-host-unreachable
icmp-port-unreachable
icmp-proto-unreachable
icmp-net-prohibited
icmp-host-prohibited
icmp-admin-prohibiteda

The processing starts at the top of the tree and goes into each relevant “subroutine” in sequence till it finds and ACCEPT or REJECT.

If you use sudo iptables -L -v it lists all the rules and the use count. For example

Chain FORWARD (policy DROP 0 packets, 0 bytes)
pkts bytes target prot opt in out source destination
...
259 16364 ufw-before-forward all -- any any anywhere anywhere

Chain ufw-before-forward (1 references)
pkts bytes target prot opt in out source destination
...
77 4620 ufw-user-forward all -- any any anywhere anywhere

Chain ufw-user-forward (1 references)
pkts bytes target prot opt in out source destination
0 0 ACCEPT all -- eno1 tap2 anywhere anywhere
0 0 ACCEPT all -- tap2 eno1 anywhere anywhere
9 540 ACCEPT all -- tap0 eno1 anywhere anywhere
0 0 ACCEPT all -- eno1 tap0 anywhere anywhere

Chain ufw-reject-forward (1 references)
pkts bytes target ...
45 2700 REJECT ... reject-with icmp-port-unreachable
  • For the packet forwarding it processed a number of “rules”
    • 259 packets were processed by subroutine ufw-before-forward
  • Within ufw-before-forward, there were several calls to subroutines
    • 77 packets were processed by subroutine ufw-user-forward
  • Within ufw-user-forward the line (in bold) said there were 9 packets, which were forwarded when the input interface was tap0 and the output was eno1.
  • Within the subroutine ufw-reject-forward, 45 packets were rejected with icmp-port-unreachable.

The ufw-reject-forward was the only instance of icmp-port-unreachable with packet count > 0. This was the rule which blocked me.

Log file

In the /var/log/ufw.log was an entry for [UFW BLOCK] for the address and port,

wireshark not working across an x11 session

I tried to use wireshark using a remote logon to a system. This failed with

This application failed to start because no Qt platform plugin could be initialized. Reinstalling the application may fix this problem.

There was an easy fix.

ssh -X u350@10.1.0.5

Use the -X option – simple.

I also saw references to the file/etc/ssh/sshd_config on the remote machine and the file needing X11Forwarding yes

If you use the following in a command window

echo $DISPLAY

it should say something like

localhost:10.0

zWireshark – capturing TCPIP trace on z/OS and displaying it in wireshark.

For example, a ping to z/OS as seen by z/OS

The TCPTRACE module runs as a batch job. It uses a documented TCPIP interface to collect packet trace data. It writes the trace data to a file which can be downloaded and used as input to wireshark.

Using the TCPTRACE module, you submit the job, run your test. Stop the job, download the file. Simple.

The documented way to collect a trace from z/OS is 

  • Start a CTRACE trace writer
  • Start CTRACE
  • Start TCP trace
  • Run your test
  • Stop TCP trace
  • Stop Ctrace
  • Stop Trace writer 
  • use IPCS to process the trace and create a file to download
  • Download the file

Which is complex and has many steps.

Ive created a github project called zWireshark. You only need the load module, the source is there for example.

Please let me know of any suggestions or improvements.

Understanding a Wireshark TLS handshake trace

I’ve done a lot of work using TLS, and Wireshark is a great tool for displaying the flows of data. The problem is understanding what the output shows! This blog post shows what to look at.

Note: Flows with GREASE values should be ignored. This is designed to make sure the remote end can handle unexpected values, by sending up unsupported values.

Summary of the flows of the handshake

See here for an overview.

  • Client to Server: Client Hello
  • Server to Client: Server Hello, Certificate, Server Key Exchange, Certificate Request, Server Hello Done
  • Client to Server: Certificate, Client Key Exchange, Certificate Verify, Change Cipher Spec, Finished
  • Server to Client: Change Cipher Spec
  • Server to Client: Finished

Client to Server: Client Hello

This displays

Transport Layer Security
    TLSv1.2 Record Layer: Handshake Protocol: Client Hello
        Content Type: Handshake (22)
        Version: TLS 1.0 (0x0301)
        Handshake Protocol: Client Hello
            Handshake Type: Client Hello (1)
            Version: TLS 1.2 (0x0303)
            Random: c5ec1cf320f2f77ba6f3f84e7fd7d1f946400484a56918a5e499b0e98be2a07f
            Session ID Length: 32
            Session ID: a839f3fcd1d7f4394c6e5bd0279da5c75458b8a81f35c5890107007cc921fa7b
            Cipher Suites Length: 32
            ▶Cipher Suites (16 suites)
            Compression Methods Length: 1
            ▶Compression Methods (1 method)j             
            Extensions Length: 429
            ▶Extension: signature_algorithms 
            Extension: Reserved (GREASE) (len=0)
            ▶Extension: supported_versions (len=7)
            ...

If you expand supported versions you get

 Extension: supported_versions (len=7)
       ...
       Supported Version: TLS 1.3 (0x0304)
       Supported Version: TLS 1.2 (0x0303)

Which shows you the TLS versions that the client supports.

If you expand Cipher Specs you get

Cipher Suites (16 suites)
   Cipher Suite: TLS_AES_128_GCM_SHA256 (0x1301)
   Cipher Suite: TLS_AES_256_GCM_SHA384 (0x1302)
   Cipher Suite: TLS_CHACHA20_POLY1305_SHA256 (0x1303)
   Cipher Suite: TLS_ECDHE_ECDSA_WITH_AES_128_GCM_SHA256 (0xc02b)
   Cipher Suite: TLS_ECDHE_RSA_WITH_AES_128_GCM_SHA256 (0xc02f)
   ...		        

This is the list of cipher specs in preference order, that the client supports.

The signature_algorithms defines which signature and hash algorithms are supported for the server’s digital certificate.

Server to Client: Server Hello, Certificate, Server Key Exchange, Certificate Request, Server Hello Done

The server sends down several blocks of data. These are logically distinct blocks of data – but tend to arrive in one block.

  • Server Hello, Here are some parameters for the handshake
  • Certificate, Here is my certificate(s)
  • Server Key Exchange,
  • Certificate Request, Please send me a certificate matching the enclosed parameters
  • Server Hello Done

Server to Client: Server Hello

Handshake Protocol: Server Hello
  Handshake Type: Server Hello (2)
  Version: TLS 1.2 (0x0303)
  Random: ...
  Session ID Length: 32
  Session ID: ...
  Cipher Suite: TLS_ECDHE_ECDSA_WITH_AES_128_GCM_SHA256 (0xc02b)
  ...  

It shows which version of TLS has been picked.

The Cipher Suite is the value picked by the server.

Server to Client: Certificate

This is present if the server is configured to send down the server’s certificate.

Handshake Protocol: Certificate
  Handshake Type: Certificate (11)
     ...
     Certificates Length: 1608
       Certificates (1608 bytes)
          Certificate Length: 734
          ▼Certificate: .. (commonName=10.1.1.2,...organizationName=NISTECCTEST)
             ▶signedCertificate
                serialNumber: 0x7a
                ▶signature (sha256WithRSAEncryption)
                ▶issuer: ...
                ▶validity ...
                ▼subject: rdnSequence (0)
                   RDNSequence (organizationName=NISTECCTEST)
                   RDNSequence (organizationalUnitName=SSS)
                   RDNSequence (commonName=10.1.1.2)
                ▶subjectPublicKeyInfo
                ▶extensions: 5 items
                algorithmIdentifier (sha256WithRSAEncryption)
                    ...
          Certificate Length: 868
          ▶Certificate:  ...

From this we can see the certificates sent down from the server.

  • The certificate name is specified at many levels; including on the Certificate and subject.
  • The CA (issuer) which signed each certificate.
  • The validity dates of the certificate
  • The extensions, which include how the certificate can be used; key usage, Subject Alternative Name ( IP address) etc.

Check this is what you are expecting, and that the CA is in your trust store.

Server to Client: Server Key Exchange

I have never used the information in this area

Server to Client: Certificate Request

Handshake Protocol: Certificate Request
   Certificate types count: 3
      ▼Certificate types (3 types)
         Certificate type: RSA Sign (1)
         Certificate type: ECDSA Sign (64)
         Certificate type: DSS Sign (2)
      ▼Signature Hash Algorithms Length: 26
         Signature Algorithm: rsa_pkcs1_sha512 (0x0601)
         Signature Algorithm: ecdsa_secp521r1_sha512 (0x0603)
         ... 
      ▼Distinguished Names Length: 246
         Distinguished Names (246 bytes)
             Distinguished Name: (commonName=COLIN4Certification Authority,...)
             Distinguished Name: (commonName=DocZosCA,...)
             Distinguished Name: (commonName=SSCA256...)

This is saying please send me a certificate:

  • The certificate must be one of certificate-type elements; RSA, ECDSA or DSS,
  • and signed by one of the algorithms listed,
  • and have a CA signer of COLIN4Certification Authority…, DocZosCA… or SSCA256… .

The CA signers are taken from the server’s trust store.

Server to Client: Server Hello Done

That’s the server side of the work done… almost

Client to Server: Certificate, Client Key Exchange, Certificate Verify, Change Cipher Spec, Finished

Client to Server: Certificate

The client needs to pick a certificate from those in its key store. Depending on the application

  • a browser may display a list of valid certificates for the end user to select
  • a program may use the information sent down in the handshake to pick the best certificate
  • a program may return what the configuration specified (such as default)
  • a program may just return the first certificate in the key file.
Handshake Protocol: Certificate
   Handshake Type: Certificate (11)
   Certificates Length: 683
   ▼Certificates (683 bytes)
     Certificate Length: 680
     ▼Certificate: … (commonName=docec384,...countryName=GB)
       ▼signedCertificate
          serialNumber: 0x029b
          ▶signature (ecdsa-with-SHA384)
          ▼issuer: rdnSequence (0)
          ▶rdnSequence: 4 items (commonName=SSCA256,OU=CA,iO=DOC,C=GB)
            ....
          ▶validity...
          ▼subject: rdnSequence (0)
              ▶RDNSequence item: 1 item (countryName=GB)
              ▶RDNSequence item: 1 item (organizationName=Doc2)
              ▶RDNSequence item: 1 item (commonName=docec384)
          ▶subjectPublicKeyInfo
          ▶extensions: 6 items...
          algorithmIdentifier (ecdsa-with-SHA384)
          ...

We can see

  • the algorithm identifier is ecdsa-with-SHA384 which is OK
  • the issuer is CN=SSA256,ou=CA,C=GB which is in the list of CAs passed from the server.
  • the signature is ecdsa – which is OK

Client to Server: Client Key Exchange

I haven’t used this. If the handshake gets this far, the set-up is good.

Client to Server: Certificate Verify

I have never used this. It is used to send up some data encrypted with the client’s private key, to check the server can decrypt it.

Client to Server: Change Cipher Spec

Response to the server. I have never used this. Business as usual, it periodically changes the Cipher Spec

Finished

Server to Client: Change Cipher Spec

Each direction has its own cipher spec. This is the server saying to the client … ok… I’m using the new cipher spec.

Server to Client: Finished

The final – final completion.

Problems

When an invalid CA was used at the client end, the server sent down

Transport Layer Security
    TLSv1.2 Record Layer: Alert (Level: Fatal, Description: Unknown CA)
        Content Type: Alert (21)
        Version: TLS 1.2 (0x0303)
        Alert Message
            Level: Fatal (2)
            Description: Unknown CA (48)

This has a list of the codes and their meaning.

Collecting a wire-shark trace with TLS active for a browser

With TLS, the data transfer is encrypted. With TLS 1.3, part of the handshake is encrypted. In Wireshark this shows up as Encrypted Application Data.

You can configure wireshark to decrypt the data flow . You need to set an environment variable, and start the application from the terminal window, to pick up the environment variable.

export SSLKEYLOGFILE=$HOME/sslkeylog.log
google-chrome

This will cause the application( the google-chrome browser) to start and to write the TLS key data to the file.

Configure Wireshark to use this file:

  • Edit
  • Preferences
  • Expand the Protocols twistie
  • Scroll down to TLS ( typing T gets you near it)
  • Enter the Master-Secret log file name mine is /home/colinpaice/sslkeylog.log

Now, if you run the test you should get the data decrypted

Transport Layer Security
 TLSv1.3 Record Layer: Change Cipher Spec Protocol: Change Cipher Spec
   Content Type: Change Cipher Spec (20)
   Change Cipher Spec Message
 TLSv1.3 Record Layer: Alert (Level: Fatal, Description: Decrypt Error)
  Opaque Type: Application Data (23)
    [Content Type: Alert (21)]
    Alert Message
      Level: Fatal (2)
      Description: Decrypt Error (51)

Strong keys may be bad for your blood pressure.

I’ve just spent a couple of days trying to get a web server to use an Elliptic key with size 521. It works on Firefox, Curl, and OpenSSL, but not on Chrome. Weaker keys work of size 256 and 384 work fine, except in some cases a key size of 256 gave did not work on z/OS.

I’ve since found a page going back to 2015 discussing the dropping of several EC cipher specs. There is also discussion “NSA Suite B says that NSA uses curves P-256 and P-384” which (to some people) implied that other elliptic curves should not be used, and so were removed. There is another discussion that P256 is as strong as P521, but requires less CPU, and so P521 should not be used.

So the short answer is use Elliptic curves with key size 256 or 256, and do not use the others.

I was trying to get the Apache HTTPD server on z/OS to use a certificate, and it failed. I tried using a similar certificate from the openssl Simple server on Linux and it failed, so I’m guessing that my Chrome version (Version 114.0.5735.198 (Official Build) (64-bit)) does not support it.

The problem

In Chrome I got

This site can’t provide a secure connection 10.1.1.2 sent an invalid response.
ERR_SSL_PROTOCOL_ERROR

This is not entirely true, as the browser sent the Alert response to the server and it was not an ERR_SSL_PROTOCOL_ERROR. After this the browser code returned its caller saying “failed” . Using Wireshark, capturing encrypted data showed the data flowing from the browser to the server to port 443),

Transmission Control Protocol, Src Port: 38188, Dst Port: 443

Transport Layer Security
  TLSv1.3 Record Layer: Change Cipher Spec Protocol: Change Cipher Spec
    Content Type: Change Cipher Spec (20)
    Change Cipher Spec Message
  TLSv1.3 Record Layer: Alert (Level: Fatal, Description: Decrypt Error)
    Opaque Type: Application Data (23)
    Alert Message
      Level: Fatal (2)
      Description: Decrypt Error (51)

In the Apache HTTPD error.log it had

SSL0209E: SSL Handshake Failed, ERROR processing cryptography. [10.1.0.2:38188 -> 10.1.1.2:443] 

Which is not very helpful. The problem occurred on the browser; all the server sees is Alert code 51.

Taking a system SSL trace on z/OS(GSK Server) gave me

Job HTTPCP8   Process 0501003C  Thread 00000032  read_tls13_alert 
  TLS 1.3 alert 51 received from ::ffff:10.1.0.2.38188. 

Diagnostics

Using tools like gsktrace on z/OS, and Wireshark to see the flow over the network. I could see that an alert was sent from the Chrome browser to server with type Decrypt Error(51). This meant it was a problem at the browser end, not the server end.

Wireshark capturing encrypted data.

If you use TLS 1.3 once the “change cipher spec” has been issued, all traffic is encrypted, and by default Wireshark cannot read it. For example

Transport Layer Security
 TLSv1.3 Record Layer: Change Cipher Spec Protocol: Change Cipher Spec
   Content Type: Change Cipher Spec (20)
     Change Cipher Spec Message
 TLSv1.3 Record Layer: Application Data Protocol: http-over-tls
   Opaque Type: Application Data (23)
     Version: TLS 1.2 (0x0303)
       Encrypted Application Data: 489be8a0976798290766c9ee158c24f5863d18
      [Application Data Protocol: http-over-tls]d

and you cannot tell this is reporting an error.

Wireshark can decrypt this. You need to set an environment variable, and start the application from the terminal window, to pickup the environment variable.

export SSLKEYLOGFILE=$HOME/sslkeylog.log
google-chrome

This will cause the application( the google-chrome browser) to start and to write the TLS key data to the file.

Configure Wireshark to use this file:

  • Edit
  • Preferences
  • Expand the Protocols twistie
  • Scroll down to TLS ( typing T gets you near it)
  • Enter the Master-Secret log file name mine is /home/colinpaice/sslkeylog.log

Now, if you run the test you should get the data decrypted

Transport Layer Security
 TLSv1.3 Record Layer: Change Cipher Spec Protocol: Change Cipher Spec
   Content Type: Change Cipher Spec (20)
   Change Cipher Spec Message
 TLSv1.3 Record Layer: Alert (Level: Fatal, Description: Decrypt Error)
  Opaque Type: Application Data (23)
    [Content Type: Alert (21)]
    Alert Message
      Level: Fatal (2)
      Description: Decrypt Error (51)

Diagnostics that were not helpful.

Chrome trace

Starting Chrome from a terminal session

google-chrome --enable-logging --v=1

The output was in ./.config/google-chrome/chrome_debug.log.

Using grep ERROR ./.config/google-chrome/chrome_debug.log gave me

...:ERROR:nss_util.cc(357)] After loading Root Certs, loaded==false: NSS error code: -8018
...:ERROR:ssl_client_socket_impl.cc(978)] handshake failed; returned -1, SSL error code 1, net_error -107

and no other useful information besides net_error -107. For these codes see here. 107 is an unhelpful message NET_ERROR SSL_PROTOCOL_ERROR.

Wireshark gave me decrypt error.

z/OS system SSL trace

Using GSKSRVR and CTRACE on z/OS. See here. This gave me

S0W1      MESSAGE   00000004  17:20:47.690772  SSL_ERROR 
  Job HTTPCP8   Process 0501003C  Thread 00000032  read_tls13_alert 
  TLS 1.3 alert 51 received from ::ffff:10.1.0.2.60830. 

Which shows the alert came from the browser.

Another way of getting system SSL trace.

The documentation says you can collect trace by changing the configuration. This allows you to trace just the pages/scripts that you want.

Creating a certificate on z/OS

On z/OS I used

RACDCERT ID(START1) GENCERT -                            
  SUBJECTSDN(CN('10.1.1.2') - 
             O('NISTECCTEST') - 
             OU('SSS')) -                                
   ALTNAME(IP(10.1.1.2))-                                
   NISTECC - 
   KEYUSAGE(   HANDSHAKE     )  - 
   SIZE(384) - 
   SIGNWITH (CERTAUTH LABEL('DOCZOSCA')) -               
   WITHLABEL('NISTECCTEST')     - 
                                                         

With different sizes 256,284, and 521. The IBM documentation says For NISTECC keys, valid key sizes are 192, 224, 256, 384, and 521 bits. I had problems with key size 521 bits.

On Linux I used

timeout="--connect-timeout 10"
enddate="-enddate 20240130164600Z" 
ext="-extensions end_user"
name="docec384"
key="$name.key.pem"
cert="$name.pem"

subj="-subj /C=GB/O=Doc2/CN="$name 
CA="docca256"
cafiles="-cert $CA.pem -keyfile $CA.key.pem "
rm $name.key.pem
rm $name.csr
rm $name.pem
passin="-passin file:password.file"
passout="-passout file:password.file"
md="-md sha384"
policy="-policy signing_policy"
caconfig="-config ca2.config"
caextensions="-extensions clientServer"
config="-config openssl.config"

openssl ecparam -name secp384r1 -genkey -noout -out $name.key.pem 
openssl req $config -new -key $key -out $name.csr -outform PEM -$subj $passin $passout 
openssl ca $caconfig $policy $ext $md $cafiles -out $cert -in $name.csr $enddate $caextensions 

openssl x509 -in $name.pem -text -noout|lessf

I used this as a template with different flavours of -name secp384r1

  • -name secp384r1
  • -name prime256v1 which worked
  • -name secp521r1 which did not work

You can get a list of valid names from the command openssl ecparam -list_curves.

Running a Linux web server

I tried using the openssl s_server, and could also reproduce this problem (with a much faster turnaround). I used

tls="-tls1_3  "
#cert=" -cert ./docec256.pem -key ./docec256.key.pem"
#cert=" -cert ./docecgen.pem -certform pem -key docecgen.key.pem -keyform pem" 
#cert=" -cert ./docec521.pem -certform pem -key docec521.key.pem -keyform pem"
cert=" -cert ./docec384.pem -certform pem -key docec384.key.pem -keyform pem" 
CA="-chainCAfile ./docca256.pem"
cipher1="-cipher TLS_AES_256_GCM_SHA384:TLS_CHACHA20_POLY1305_SHA256:TLS_AES_128_GCM_SHA256:ECDHE-ECDSA-AES256-GCM-SHA384"

cipher=$cipher1
port="-port 4433 "

strict="-x509_strict -strict"
debug="-trace"

#  ca="-CAfile ./zpdt.ca.pem "
openssl s_server $port $tls  $cert $cipher $CA $debug $strict -www  

Chrome startup options

You can start chrome from a terminal with many startup options. See here

Collecting a tcpip packet trace on z/OS.

I needed to collect a packet trace to see the details of a ping request. There is a lot of good documentation, but it is spread around, and not linked up.

It looks like a packet trace is associated with an interface or a device/link pair (but it may not be).

Thanks to Erik Janssen who explained that you can format a packet trace suitable for Wireshark. I’ve added his comments below; and to Peter Vels who pointing out some typos which meant some of the the commands did not work!

Overview

  • The TCPIP trace uses z/OS CTRACE capabilities, which requires a procedure (or job) to write trace data into a file.
  • You need some a procedure (or a job) called the trace write, which CTRACE uses to write to a dataset.
  • You need to start the trace writer
    • You can do this with parmlib members,
    • or reply to a WTOR
  • You need to enable the TCPIP trace
  • Recreate the problem
  • Disable the TCPIP trace
  • Stop the trace writer
    • Either with a parmlib member
    • or with a WTOR
  • Use IPCS to format the trace

Create a procedure to collect the trace

See IBM documentation. My JCL is

//CTWTR PROC 
//DELETE  EXEC PGM=IEFBR14 
//TRCOUT01 DD DSNAME=IBMUSER.CTRACE1, 
// SPACE=(CYL,(10),,CONTIG),DISP=(MOD,DELETE) 
//* 
//IEFPROC EXEC PGM=ITTTRCWR,TIME=999 
//TRCOUT01 DD DSNAME=IBMUSER.CTRACE1, 
// SPACE=(CYL,(10),,CONTIG),DISP=(NEW,CATLG) 
//SYSPRINT DD SYSOUT=* 

Notes:

  • You hard code the data set name, you cannot use symbols
  • You cannot pass parameters to it.
  • Do not specify DCB information, the system determines the best blocking.
  • You can specify more than one trace output data set
  • You might want use multiple procedures such as SYS1TCP1, SYS2TCP2, SYS1TCPP etc.

Start the trace writer

Start the trace writer by hand

TRACE CT,WTRSTART=CTWTR

where CTWTR is the name of your procedure.

Activate the trace collecting for the component

TRACE CT,ON,COMP=SYSTCPDA,SUB=(TCPIP) 

Which then issues WTOR and waits for you to respond to it.

R nn,WTR=CTWTR,END 

By having a WTOR you cannot easily automate the command.

Start the trace by parmlib member

TRACE CT,ON,COMP=SYSTCPDA,SUB=(TCPIP),PARM=name

Name is a member of the parmlib concentration. The name must begin with CT. My member is CTTCPS ( CT TCP Start).

This member has

TRACEOPTS                         
  WTRSTART(CTWTR) WRAP            
  ON  WTR(CTWTR)                  

It is one command to issue. It can be used in automation or scripts because it does not use WTOR.

Once the trace has been started

You can use the DISPLAY TRACE z/OS operator command to display the status

D TRACE,WTR=ALL

gave me

  WRITER  STATUS    HEAD  COMPONENT  SUBNAME                      
 --------------------------------------------------------------   
 CTWTR    ACTIVE          SYSTCPDA  TCPIP                         

d trace,comp=all
or
d trace,comp=systcpda

gave me

 COMPONENT     MODE BUFFER HEAD SUBS 
-------------------------------------
 SYSTCPDA      OFF         HEAD    1 
    NO HEAD OPTIONS                  

Define the trace to TCPIP

V TCPIP,TCPIP,PKTTRACE,ON,…. 

Depending on your system you may need to filter what is collected. If this is a one person z/OS image, you might not need to filter.

You can trace by

  • IP address – if the source or target matches. This means you can capture the trace for just one machine.
  • Interface name
  • Link name
  • Destination port number
  • Source port
  • Protocol TCP, ICMP, UDP

You can trace by having the trace data in a file PKTTRON

PKTTRACE 
   INTFNAME=IFPORTCP6 
   PROT=ICMP 
   ON 

and member PKTTROFF

PKTTRACE 
   INTFNAME=IFPORTCP6 
   PROT=ICMP 
   OFF

and use

v tcpip,,obeyfile,USER.Z25A.TCPPARMS(PKTTRON)

or use the trace command, such as

V TCPIP,TCPIP,PKTTRACE,ON,IPADDR=xx.xxx.xxx.xxx

Is trace enabled?

Surprisingly the display trace command (D TCPIP,,DISPLAY,TRACE) does not display the trace. This command is used to display information about network management applications that use the real-time application-controlled TCP/IP trace network management interface (NMI) to obtain real-time network management data from the TCP/IP stack.

You have to display information about the devices or interfaces.

tso netstat devlinks(intfn ifportcp6

Packet Trace Setting:

   Isolate: No                      OptLatencyMode: No
   TempPrefix: All
 Packet Trace Setting:
  Protocol: ICMP              TrRecCnt: 00000000  PckLength: FULL
  Discard:  NONE
  SrcPort:  *                 DestPort: *         PortNum: *
  IpAddr:   *                 SubNet:   *

If there is no trace, then the Packet Trace section is absent.

Stop the TCPIP trace

You can do the the opposite of when you turned it on, for example

V TCPIP,TCPIP,PKTTRACE,OFF,IPADDR=xx.xxx.xxx.xxx

or use an obeyfile, such as member PKTTROFF (see above).

Stop the trace writer

You can either use

  • TRACE CT,ON,COMP=SYSTCPDA,SUB=(TCPIP) 
  • R nn,WTR=DISCONNECT,END
  • TRACE CT,WTRSTOP=CTWTR

Or

TRACE CT,OFF,COMP=SYSTCPDA,SUB=(TCPIP),PARM=CTTCPP

Where parmlib member CTTTCPP has

TRACEOPTS WTRSTOP(CTWTR) 
  OFF 

If you get

ITT038I NONE OF THE TRANSACTIONS REQUESTED VIA THE TRACE CT COMMAND WERE
SUCCESSFULLY EXECUTED.

Then the trace is still active. Check you have stopped collecting the TCPIP trace, and you have issued the stop writer request.

You have to issue

TRACE CT,OFF,COMP=SYSTCPDA,SUB=(TCPIP),PARM=CTTCPP

a second time for the trace to stop, and the writer to stop.

The data set you specified in the WTR JCL may have some data in it.

You need to use IPCS to format it.

  • IPCS option 0 (Specify Defaults) and enter DSNAME(‘IBMUSER.CTRACE1’)  
  • IPCS option 6 (IPCS Subcommand Entry) and enter

This gives output like the following for PING6 to fe80::7:7:7:7.

From Interface    : IFPORTCP6        Device: QDIO Ethernet6   Full=104 
 Tod Clock        : 2022/09/24 11:30:32.614976                Intfx: 81
 Segment #        : 0                Flags:  Ping In                   
 Source           : fe80::4081:88ff:fec5:b624                          
 Destination      : fe80::7:7:7:7                                      
                                     Asid: 0035 TCB: 00000000          
 QID              : 1                                                  
IpHeader: Version : 6                Header Length: 40                 
 Class:           : 00               Flow: 03CE34                      
 Payload Length   : 64                                                 
 Hops             : 64               Protocol: ICMPv6                  
 Source           : fe80::4081:88ff:fec5:b624                          
 Destination      : fe80::7:7:7:7                                      
                                                                       
ICMPv6                                                                 
 Type/Code        : 80/0             ECHO Request                      
 CheckSum         : 1A35 FFFF                                          
 Id               : 0004             Seq: 1                            
 Echo Data        : 56                                                  

Notes:

  • It says From Interface. This shows data was coming from the interface into TCPIP
  • Flags: Ping In this was ping request
  • It came from fe80::4081:88ff:fec5:b624
  • Heading towards fe80::7:7:7:7 on z/OS
To Interface      : IFPORTCP6        Device: QDIO Ethernet6   Full=104  
 Tod Clock        : 2022/09/24 11:30:32.615816                Intfx: 81 
 Segment #        : 0                Flags:  Ping Out                   
 Source           : fe80::7:7:7:7                                       
 Destination      : fe80::4081:88ff:fec5:b624                           
                                     Asid: 0035 TCB: 00000000           
 Next Hop         : fe80::4081:88ff:fec5:b624                           
IpHeader: Version : 6                Header Length: 40                  
 Class:           : 00               Flow: 03CE34                       
 Payload Length   : 64                                                  
 Hops             : 255              Protocol: ICMPv6                   
 Source           : fe80::7:7:7:7                                       
 Destination      : fe80::4081:88ff:fec5:b624                           
                                                                        
ICMPv6                                                                  
 Type/Code        : 81/0             ECHO Reply                         
 CheckSum         : 1935 FFFF                                           
 Id               : 0004             Seq: 1                             
 Echo Data        : 56                                                                                                                                         

Notes:

  • It says To Interface. This shows data was going to the interface from TCPIP
  • Flags: Ping Out this was ping response
  • It came from fe80::7:7:7:7 on z/OS
  • Heading towards fe80::4081:88ff:fec5:b624. This is the same address as the input request.

The above entries are as expected.

I set up an IP address for my IP V6 interface and did a ping to it (ping6 -I tap2 2000::67:1:1:).

This gave me a trace entry

From Interface    : IFPORTCP6        Device: QDIO Ethernet6   Full=104 
 Tod Clock        : 2022/09/24 11:30:25.470408                Intfx: 81
 Segment #        : 0                Flags:  Ping In                   
 Source           : 2a00:23c5:978f:6e01:307a:2e51:9020:afc5            
 Destination      : 2000::67:1:1
...                                       

Notes:

  • It says From Interface. This shows data was coming from the interface into TCPIP
  • Flags: Ping In this was ping request
  • It came from 2a00:23c5:978f:6e01:307a:2e51:9020:afc5. This is different to the previous address of fe80::4081:88ff:fec5:b624 – on the same machine
  • Heading towards 2000::67:1:1. This tells us the data came in on the IFPORTCP6 interface as before.
  • There was no return Ping Out record, so the request was lost in TCPIP on z/OS.

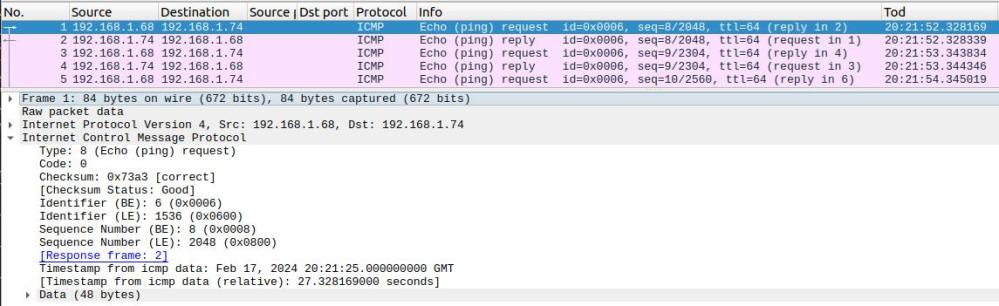
Using Wireshark to look at the packet flow.

Getting the data into Wireshark format.

Wireshark is an excellent tool for doing network trace, and decoding the flows. You can also is it to process the CTRACE data. Thanks for Erik Janssen for the instructions below on how to get from CTRACE to Wireshark.

You need to use the CTRACE SNIFFER option. This writes to the file with DDNAME of SNIFFER.

Allocate a VB 8000 LRECL dataset and allocate it to a ddname, for example SNIFFER.
ALLOC DD(SNIFFER) DS(<some dsname>) SHR
From IPCS you can now:
CTRACE COMP(SYSTCPDA) OPTIONS((SNIFFER(3100,TCPDUMP) NOREASSEMBLY) GMT

The formatted trace will now be in <some dsname>.

Do a binary transfer to your pc and you show be able to open the trace in Wireshark. File -> Open.

IPCS in Batch

I tend to use IPCS in batch (so I do not get the lock on the trace file, (grin)).

//IBMIPCS JOB 1,MSGCLASS=H 
//DEL  EXEC PGM=IEFBR14 
//SNIFFER  DD DISP=(MOD,DELETE),DSN=COLIN.SNIFFER, 
//     RECFM=VB,LRECL=8000,SPACE=(CYL,(10,10)),BLKSIZE=32000 
//ALLOC  EXEC PGM=IEFBR14 
//SNIFFER  DD DISP=(NEW,CATLG),DSN=COLIN.SNIFFER, 
//     RECFM=VB,LRECL=8000,SPACE=(CYL,(10,10)),BLKSIZE=32000 
//S1  EXEC PGM=IKJEFT01,REGION=0M 
//STEPLIB  DD  DISP=SHR,DSN=SYS1.MIGLIB 
//SNIFFER  DD DISP=SHR,DSN=COLIN.SNIFFER 
//SYSPRINT DD SYSOUT=* 
//SYSTSPRT DD SYSOUT=* 
//SYSPROC    DD  DISP=SHR,DSN=USER.Z24C.CLIST 
//           DD  DISP=SHR,DSN=ADCD.Z24C.CLIST 
//           DD  DISP=SHR,DSN=SYS1.SBLSCLI0 
//IPCSPARM   DD  DISP=SHR,DSN=SYS1.PARMLIB 
//           DD  DISP=SHR,DSN=ADCD.Z24C.PARMLIB 
//IPCSTOC    DD  SYSOUT=* 
//IPCSDDIR   DD  DISP=SHR,DSN=SYS1.DDIR 
//SYSTSIN DD * 
 IPCS NOPARM 
 SETDEF DA('IBMUSER.CTRACE1')                                         
 DROPD                                                                
CTRACE COMP(SYSTCPDA) OPTIONS((SNIFFER(8000,TCPDUMP) NOREASSEMBLY) GMT
/*                                                                    
 CTRACE COMP(SYSTCPDA) SUB((TCPIP)) LOCAL FULL SUB((TCIP)) GMT SHORT 
    

Note: The CTRACE command has to fit on one line.

Collecting a SYSTCIP trace

trace ct,wtrstart=CTWTR

TRACE CT,ON,COMP=SYSTCPIP,SUB=(tcpip),PARM=ctiezbcp

trace ct,wtrstop=CTWTR

 and use

CTRACE COMP(SYSTCPIP) SUB((TCPIP)) LOCAL FULL

to process it in IPCS.