To get static routing working I needed a route like one of
# specific destination
sudo ip -6 route add fc:1::9/128 via fc::2 dev enp0s31f6r
sudo ip -6 route add fc:1::9/128  via fc::2
#range of addresses
sudo ip -6 route add fc:1::/64 via fc::2  dev enp0s31f6
sudo ip -6 route add fc:1::/64 via fc::2
If I a route without the via
sudo ip -6 route add fc:1::9/128 dev enp0s31f6
then it ignored my static routing and did Neighbor Solicitation; it asked adjacent systems if they had knew about the IP address fc:1::9. This is an IP V6 Neighbour Discovery facility.
There were hints around the internet that if the next hop address is not specified, then the “next hop router” will try to locate the passed address.
So the short answer to the question is: “yes. You should specify it when using static routing”.
I’m sure every one reading this post has the kindergarten level of knowledge of ping (when it works), the hard part is when ping does not work. Ping can do so much more.
Pinging 101
If you successfully ping an IP address you get a response like
PING 2001:db8::7(2001:db8::7) 56 data bytes
64 bytes from 2001:db8::7: icmp_seq=1 ttl=64 time=0.705 ms
64 bytes from 2001:db8::7: icmp_seq=2 ttl=64 time=0.409 ms
First steps
For the ping to be successful the ping has to get to the remote end, and the response needs to get back to the originator. This has two implications (which are obvious once you understand)
At each hop the node needs to know how to get to the destination.
At each hop the node needs to know how to get to the originator.
If the remote end does not have a routing definition to get to the originator, the response will get thrown away, and your ping will time out.
Did it leave/arrive in mybox?
Depending on how heavily used your system is displaying the number of bytes and packets sent over an interface may be of some help. If the number is zero, then the interace was not used. If the number is non zero, this could be caused by your ping, or by some other traffic.
Using TSO NETSTAT DEVLINKS and a ping -c1 192.168.1.74 (for one ping)
If forwarding is not specified, the ping request will come in on one interface and be thrown away.
Pinging to a multicast address
With multicast you can send the same data to multiple destinations on a connection(interface), or on a host.
You can issue
ping ff02::1%tap1
where
ff02::1 is an IP V6 multi cast address – ff02 is for everything on this link
%tap1 says use the interface tap1. Without it, ping does not know which link to send it to.
Wireshark shows the source was fe80::5460:31ff:fed4:4587 which is the address of the interface used to send out the request.
The output was
PING ff02::1%tap1(ff02::1%tap1) 56 data bytes
64 bytes from fe80::5460:31ff:fed4:4587%tap1: icmp_seq=1 ttl=64 time=0.082 ms
64 bytes from fe80::7:7:7:7%tap1: icmp_seq=1 ttl=255 time=3.36 ms (DUP!)
64 bytes from fe80::5460:31ff:fed4:4587%tap1: icmp_seq=2 ttl=64 time=0.082 ms
64 bytes from fe80::7:7:7:7%tap1: icmp_seq=2 ttl=255 time=3.01 ms (DUP!)
64 bytes from fe80::5460:31ff:fed4:4587%tap1: icmp_seq=3 ttl=64 time=0.083 ms
64 bytes from fe80::7:7:7:7%tap1: icmp_seq=3 ttl=255 time=3.22 ms (DUP!)
The z/OS host, has two IP addresses for the interface – and both of them replied.
Pinging from a different address on the machine
I had a server where there as
an Ethernet connection to my laptop. The server end of the connection had address 2001:db8::2
an Ethernet like connection to z/OS running through a tunnel. The device (interface) was called tap1.
To ping to the multicast address, as if it came from 2001:db8::2, the address of an Ethernet connection on the same machine, you can use
ping -I 2001:db8::2 ff02::1%tap1
Wireshark shows the source was 2001:db8::2.
The output was
PING ff02::1%tap1(ff02::1%tap1) from 2001:db8::2 : 56 data bytes
64 bytes from 2001:db8:1::9: icmp_seq=1 ttl=255 time=3.15 ms
64 bytes from 2001:db8:1::9: icmp_seq=2 ttl=255 time=1.22 ms
64 bytes from 2001:db8:1::9: icmp_seq=3 ttl=255 time=3.21 ms
without the duplicate responses (I do not know why). (It may be due to the global address 2001… compare with the link-local address 9e80…)
You might use this ping from a different address when checking a firewall. The firewall may be restricting the source of a packet.
The problems of ping using a different address on the machine
I had a wireless connection, and an Ethernet connection to my laptop. If I pinged through my server to z/OS, the “return address” was from the wireless connection. z/OS was not configured for this, so the reply to the ping was lost.
Even trying to force the interface id to use with
ping -I enp0s31f6 2001:db8:1::9
The wireless connection was chosen, and ping gave a message
ping: Warning: source address might be selected on device other than: enp0s31f6
I had to give my Ethenet connection an address, and change the route to add the src
sudo ip -6 addr add 2001:db8::7 dev enp0s31f6
sudo ip route replace 2001:db8:1::/64 via fe80::a2f0:9936:ddfd:95fa dev enp0s31f6 … src 2001:db8::7
Only then did the ping request get to z/OS – but z/OS did not know how to get back to my laptop!
A normal Wireshark trace
This shows the request and the reply.
Why can ping fail?
If you only get the request data in the Wireshark trace, this means no reply was sent back.
This could be for many reasons including
The IP address (2001:db8::1:0:0:9 in the wireshark output above) could not be reached. This could be due to
A fire wall dropped it
It could not be routed on
The address did not exist
The response could not be sent back
A firewall blocked it
There is no routing from the destination back to the originator
The 2001:db8:0:0:1::/64 says traffic for 2001:db8:0:0 is on this system, and traffic for 2001:db8::/64 is off this host.
When ping tried to reply – it tried to send the packet to 2001:db8::/64 – which was routed to the same host and so IP just dropped the packet.
I needed 2001:db8:0:0:1::/80. This says traffic for 2001:db8:0:0:1 is on this system. I also used 2001:db8::/80 which is 2001:db8:0:0:0/80 is off this host. The /80 gave the finer granularity.
Once you know these things, it is obvious. This is called experience.
Another example of a failure
As part of writing up another blog post, I created my network to use only address fc00:…
With this, ping failed to work.
The reason for this was that at the back-end, I could see the source was an 2001:db8:… address, which was not configured in my back-end.
On my front end system my Ethernet device had
2: enp0s31f6: <BROADCAST,MULTICAST,UP,LOWER_UP> mtu 1500 state UP qlen 1000
    inet6 fc::7/128 scope global
       valid_lft forever preferred_lft forever
    inet6 2001:db8::4cca:6215:5c30:4f5e/64 scope global temporary dynamic
       valid_lft 84274sec preferred_lft 12274sec
    inet6 2001:db8::51d8:9a9f:784:3684/64 scope global dynamic mngtmpaddr noprefixroute
       valid_lft 84274sec preferred_lft 12274sec
    inet6 fe80::9b07:33a1:aa30:e272/64 scope link noprefixroute
       valid_lft forever preferred_lft forever
I deleted this using
sudo ip -6 addr del 2001:db8::4cca:6215:5c30:4f5e/64 dev enp0s31f6
and ping worked!
When I added it back in, ping continued to work. I cannot find which interface address ping uses.
Of course I could have used
ping -I fc::7 fc:1::9
to which interface address to use!
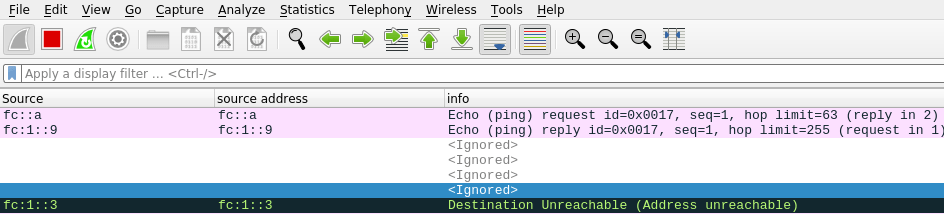
A failure with a hint
I had a WiresShark output
The destination Unreachable had
Internet Control Message Protocol v6
Type: Destination Unreachable (1)Code: 3 (Address unreachable)
...
Internet Protocol Version 6, Src: fc:1::9, Dst: fc::a
Internet Control Message Protocol v6
This is saying that at the server end of the link to z/OS, where the server end had address fc:1::3 ( see the data at the start of the black line) was unable to deliver the packet to dst: fc::a. This shows the problem is with the server in the middle rather than z/OS.
The solution turned out to be more complex than I first though.
I tried
sudo ip -6 route add fc::/64 dev eno1 via fc::7
but this gave
RTNETLINK answers: No route to host
On the laptop I did
ip -6 addr
which gave me
enp0s31f6: <BROADCAST,MULTICAST,UP,LOWER_UP> mtu 1500 state UP qlen 1000
    inet6 fc::7/128 scope global
       valid_lft forever preferred_lft forever
    inet6 fe80::9b07:33a1:aa30:e272/64 scope link noprefixroute
       valid_lft forever preferred_lft forever
back on the server I replaced fc::7 with fe80::9b07:33a1:aa30:e272
sudo ip -6 route add fc::/64 dev eno1 via fe80::9b07:33a1:aa30:e272
DestIP: Default this is statically set up with default6
Gw: 2001:db8:1::3 This is (one of) the IP address at the remote end of the connection.
Intf: IFPORTCP6 The z/OS interface name is IFPORTCP6
The flags are
U – The route is up.
G – The route uses a gateway.
H – The route is to a host rather than to a network.
S – The route is a static route not replaceable by a routing daemon or router advertisements (IPv6).
D – The route was created dynamically by ICMP processing or router advertisements (IPv6) (possibly OMPROUTE).
DestIP: 2001:db8::/64 This is for IP addresses 2001:0DB8:0000:0000:something there are 64 bits in the significant part of the address. This applies to 2001:0DB8:0:0:0:0:0:99 and 2001:0DB8:0:0:FFFF:0:0:99 for example
DestIP: 2001:db8:1::3/128 This says all 128 bits are significant in the address. This is the 2001:db8:0:0:0:0:0:3 and no other address.
RefCnt Reference count – the current number of active users for the route. See below.
Where does an entry come from?
An entry can be statically configured between BEGINRoutes… ENDoutes.
An entry can be dynamically configured from an adjacent system. For example
a prefix entry when using radvd – this defines IP address ranges into or through the z/OS host
a route entry when using radvd, this defines IP address ranges going off the host, to the other end of the connection.
An entry be generated dynamically from OSPF and RIP. On z/OS these are usually configured with the OMPROUTE address space. See below.
A statically defined entry has an S in the Flgs
A dynamic entry has a D in the Flgs -sometimes – see below.
Why does Gw: sometimes have a value?
Gw: has a value when
it was specified in the static definitions
the DestIP entry was created dynamically, for example as a route …{} statement in radvd. This is an output entry, so the Gw: is part of the definition.
Note: a radvd prefix… {} entry is inbound, so the gateway is irrelevant.
I see this as it is only relevant for connections out of z/OS. When traffic comes into the host, you do not care which gateway it came from.
What does refcnt mean for a DestIP?
The documentation it says “Reference count (RefCnt): The current number of active users for the route.”
When I pinged z/OS ten times from 2001:db8::7, the RefCnt for DestIP: 2001:db8::/80 increased by 10.
When I pinged z/OS ten times from another address, the RefCnt values were unchanged.
Issuing a traceroute to the system did not increment any values.
I could find no active connections to this interface, so all in all this field is bit of a mystery.
The Linux documentation says The reference count (i.e. attached processes via this socket), so the z/OS meaning may be a partial historical count of usage rather than the number of active users.
What is the default value?
This was a surprise. I had defined a static route using default6, and this was in the netstat route display output.
When I used
tso netstat route radv
to display the routes added via Router Advertisement it gave me a list including a Default.
Note: It seems you can have only one active Default, even with IPCONIG6 MULIPATH option. I do not know which default becomes active if you have more than one dynamically defined
The detail option
If you use TSO NETSTAT ROUTE DETAIL you get additional information.
Metric: 00000001
MVS Specific Configured Parameters:
  MaxReTransmitTime:  120.000   MinReTransmitTime: 0.500
  RoundTripGain:      0.125     VarianceGain:      0.250
  VarianceMultiplier: 2.000     DelayAcks:         Yes d
These numbers look like defaults, and I got them even when not traffic had flowed over the connection.
OMPROUTE
OMPROUTE can
Provides some “dynamic” information about default IP6 routes
It listens to messages from other routers, and can update the routing tables
Sometimes
Without OMPROUTE, routes that were dynamically created, for example using radvd on Linx, which broadcast z/OS address ranges to z/OS, and advertised “come to me for these address ranges”.
These could be seen as Dynamic, for example the D in UD below.
I could not ping my Linux Server, and could not issue a traceroute command. It turns out the firewall was blocking the traceroute flow.
This blog posts describes how I checked this, and fixed the firewall problem.
Traceroute sends (by default) a UDP packet to a port address in the range 33434-33523. It usually responds with a “timed out” type response. If there is no response then there is a good chance that the packet is being dropped by a firewall.
Using wireshark I could see UDP packets going in to my Linux, but there was no corresponding reply being returned.
When traceroute worked I got the out inbound UDP packet, and the outbound response with “destination unreachable” (which looks like a problem but actually shows normal behaviour) as shown in the data below. Wireshark highlights it with a black background, because it thinks it is a problem.
Source
Destination
Dst Port
port
Protocol
Info
2001:db8::2
2001:db8::7
33434
52119
UDP
52119 → 33434 Len=24
2001:db8::7
2001:db8::7
33434
52119
ICMPV6
Destination Unreachable (Port unreachable)
When traceroute failed I only got the inbound UDP packet
Source
Destination
Dst Port
port
Protocol
Info
2001:db8::2
2001:db8::7
33434
52119
UDP
52119 → 33434 Len=24
If the packets is blocked by a firewall, then the traceroute output will have “*” as the node name.
Status: active
Logging: off (low)
Default: deny (incoming), allow (outgoing), deny (routed)
New profiles: skip

To                         Action      From
--                         ------      ----
Anywhere                   ALLOW IN    10.1.1.2
22/tcp                     ALLOW IN    Anywhere
20,21,10000:10100/tcp      ALLOW IN    Anywhere
21/tcp                     ALLOW IN    Anywhere
20/tcp                     ALLOW IN    Anywhere
22/tcp (v6)                ALLOW IN    Anywhere (v6)
20,21,10000:10100/tcp (v6) ALLOW IN    Anywhere (v6)
21/tcp (v6)                ALLOW IN    Anywhere (v6)
20/tcp (v6)                ALLOW IN    Anywhere (v6)
By default,
incoming data is blocked
outbound data is allowed
routed data is blocked.
Logging is off, and problems are not reported.
The displays shows there are no rules for UDP – so any incoming UDP request is blocked (quietly dropped = dropped without telling anyone).
You may want to issue the command and pipe the output to a file, ufw.txt, to keep a record of the status before you make any changes. If you make any changes, they persist – even across reboot.
Enable logging to see what is being blocked
sudo ufw logging on
Rerun your traceroute or command.
At the bottom of /var/log/ufw I had (this has been reformatted to make it display better)
I was trying to use traceroute to find the route between two nodes and I did not understand the output. Like many things, once you understand it, is obvious.
This is another of the little topics which I thought I understood, and found I did not.
For example
traceroute ibm.com
produces
traceroute to ibm.com (23.39.199.16), 30 hops max, 60 byte packets
 1  bthub.home (192.168.1.254)  4.139 ms  7.528 ms  10.629 ms
 2  * * *
 3  * * *
What does the “*” mean – and why are there 3 “*”?
On Linux there is the command
ip -6 route get to 2001:db8:1::9
which display information like
2001:db8:1::9 from :: via fe80::a2f0:9936:ddfd:95fa dev enp0s31f6 proto ra src 2001:db8::e02a:bfec:a02e:f17 metric 100 pref medium
Traceroute logic
At a conceptual level, the logic of traceroute is:
At the origin
Send a UDP packet over a link towards the remote node, with hop limit = 1.
Set a timer
Wait for the reply (with time out)
At an intermediate node
Set hop limit = hop limit -1
If hop limit = 0
then send a UDP packet back to the originator, giving the IP address of the intermediate node, and information like “Destination unreachable (Port unreachable)”, or “request timed out”.
else send the packet over a link towards the remote destination.
Back at the origin
Wait for the response. When the response arrives, stop the timer and calculate the duration.
Lookup the IP address of the intermediate node, to find the node name.
Display original hop count, the name of the intermediate node, IP address of the intermediate node, and duration of the request.
For example
1 colin.Linux.Server (2001:db8::2) 0.988 ms
This gives you information on the first hop in the chain.
Go to the next level.
You can take this further.
Repeat the operation multiple times. This allows you to get multiple response times, so you can see the range of responses times, and get an idea of the variation (or consistency) of the response time.
Repeat it with hop count = 2,3,4,5… . When the hop count is 1, you get information about the first hop, when the hop count is 2, you get information about the next hop etc.
For example for Linux
traceroute to 2001:db8:1::9 (2001:db8:1::9), 30 hops max, 80 byte packets
1 colin.Linux.Server (2001:db8::2)0.267 ms 0.207 ms 0.140 ms
2 Colin.zOS (2001:db8:1::9) 3.794 ms 6.215 ms 6.920 ms
It gets more interesting.
If you send multiple request, a node may decide to route the request down a different link, so you may get multiple IP addresses for each hop.
What if there is a problem?
Unknown address
Traceroute will report as much as it can. For example 2001:db8:1::10 does not exist.
traceroute to 2001:db8:1::10 (2001:db8:1::10), 30 hops max, 80 byte packets
1 colinpaice (2001:db8::7) 3053.091 ms !H 3052.807 ms !H
This reports as far as it got (colinpaice 2001:db8::7); and !H. On Linux you can have additional information (!H)
!H host unreachable
!N network unreachable
!P protocol unreachable
!S source route failed
!F fragmentation needed
!X communication administratively prohibited
!V host precedence violation
!C precedence cutoff in effect
!<num> ICMP unreachable code <num>
Lost or dropped packets
A intermediate node may not be able to send the response back, for example, a firewall may block (and drop) any UPD packets. The originator times-out waiting for the reply. In this case it reports “*” as the IP address, and cannot provide the duration of the requests. This can occur if the router does not support traceroute, there is no link back to the originator, or there is a firewall which drops packets (going out, or coming back).
More advanced requests
Specify a different home
By default traceroute uses the IP address of the connection it will use to send the packet.
For example I have a system with two interfaces
tap1,my end of the connection is 2001:db8:1::3 with the remote end having 2001:db8:1::9 (my z/OS)
eno1, my end of the connection is 2001:db8::2 with the remote end having 2001:db8::7 (my laptop)
If I use traceroute to my laptop, I can issue
traceroute 2001:db8::7
by default traceroute uses 2001:db8::2 as its starting point (the IP adddess of the direct connection). I can see this in the wireshark trace.
I can use traceroute to my laptop , and say start from the IP address of the connection to z/OS
traceroute6 -s 2001:db8:1::3 2001:db8::7
-s says use a different starting address 2001:db8:1::3 – corresponding to the link to z/OS as its starting point.
When I used this command, my request was blocked, as my firewall was configured to accept traffic from 2001:db8:2, and not from 2001:db8:1::3.
Make traceroute fail quicker
The traceroute defaults are to try a maximum of 30 hops and wait 5 seconds so you could wait for over 2 minutes if there was a problem). If you know your network is small (at most 3 hops) and responds in under a second, you can use
When using z/OS I have to reply to messages, for example at startup and shutdown. After several months of this I was getting bored, and found z/OS has an auto reply capability.
In the SYS1.PARMLIB concatenation you can have AUTORxx members.
For example in SYS1.PARMLIB(AUTOR00) is
/* ARC0380A RECALL WAITING FOR VOLUME volser IN USE BY HOST procid, */
/*          FUNCTION function. REPLY WAIT, CANCEL, OR MOUNT         */
/*                                                                  */
/* Rule: 1                                                          */
/*                                                                  */
   Msgid(ARC0380A)   Delay(60S) Reply(CANCEL)
So if you get message ARC0380A, after 60 seconds it will reply CANCEL. If you are quick you could reply with something else.
If you always reply with the same value you could specify DELAY(0S)… but this means you cannot reply to the message with a different value… DELAY(5S) may be better.
You can specify multiple values in the REPLY(a,b,c), and can use system symbolics such as &SYSNAME.
REPLY(‘system=&SYSNAME.’,‘,option1,option2’)
My parmlib member IEASYS00 includes AUTOR=(00,DT), so members AUTOR00 and AUTORDT are used.
While working on getting IP V6 to work, I had problems getting my routing on z/OS working properly. I spent a few days working with TCPIP dynamic routing. What I have written below is what I have learned, it may well be wrong!
The problem…
With TCPIP you can define static routes. For example
  BEGINRoutes
  ; Destination        SubnetMask    FirstHop       LinkName    Size
  ROUTE 9.114.209.0    255.255.255.0    =            ETH2   MTU 1492
  ROUTE DEFAULT             10.1.1.1                 ETH1   MTU 1492
  ROUTE DEFAULT6  FE80::8C46:FAFF:FE86:1721    IFPORTCP6  MTU 1492
  ENDRoutes
This says
To send data IP V4 address9.114.209.* go via the link ETH2.
Otherwise send all IPV4 traffic to link ETH1 which has address 10.1.1.
Send all IP6 traffic to link IFPORTCP6 – which has an IP address of FE80::8C46:FAFF:FE86:1721.
Maintaining lists like these quickly become unmanageable as the size of the network increases.
Dynamically finding the configuration
To solve this problem TCPIP was enhanced to allow the system to discover information. The OMPROUTE daemon manages this.
When OMPROUTE is started, it queries the TCPIP configuration. It merges this information with its configuration data, and sends a request out to participating interfaces “Hello – who are you connected to”. From this information it can build a pictures of the network.
The “Hello – who are you connected to” could produce a lot of output; you can get information about all the links and routers in your environment.
You can divide your network (from an OMPROUTE perspective ) into areas, and so only routers within an area exchange information. The areas have a number like 1.1.1.1.
The main backbone has number 0.0.0.0 You can send requests between areas. Routers which connect an area to the backbone are called Area Border Routers.
An Area Border Router can be configured as a default route – if a router does not know where to send the packet, send it to the Area Border Router.
Where is this information stored?
It looks like this configuration information is stored in the TCPIP address space, because if you shut down OMPROUTE, the configuration persists. I do not think the information will be updated, until OMPROUTE is restarted.
Routing packets
When a packet needs to be sent to a destination it uses the information provided by OMPROUTE. It uses two algorithms,
OSPF -Open shortest path first. As the state of an element in the network changes – the change is broadcast to all the routers. This means a router can quickly respond to a configuration change.
RIP – Routing interface protocol. This uses the number of hops. (I would have thought this was the same as the shortest path.) A RIP router has a 30 second heartbeat with its connected networks. If it has not received a response after 180 seconds, it assumes the network link is down.
It looks like OSPF is the better protocol, it is faster to respond to changes, and listens to changes, rather than using a heartbeat, and looks like it scales better.
Creating OMPROUTE
The documentation is not the clearest. I think it assumes you are an expert before you start.
The …TCPIP(PROF2) had “520 UDP OROUTED ; RouteD Server”. This name needs to match your started task proc. Either change the TCPIP profile, or use OROUTED as your proc name.
OMPROUTE procedure needs a userid with an OMVS segment.
Create RACF started task profile. Profile OMPROUTE.* with CLASS(STARTED). STDATA INFORMATION user=…
I created USER.Z25A.tcpparms(omp) and copied TCPIP.SEZAINST(EZAORCFG) into it.
Initially I forgot to use define the RACF profile CLASS(OPERCMDS) MVS.ROUTEMGR.OMPROUTE
The OMPROUTE configuration is in //OMPCFG … USER.Z25A.TCPPARMS(OMP)
Setting up syslogd
If you are not running SYSLOGD, all of the console messages are prefixed with
BPXF024I (TCPIP) Oct 6 10:11:10 omproute 67174435 : …
When running with SYSLOGD, the default syslogd configuration is to write errors to a file (for example into /var/log/2022/10/06/errors) , and throws away the remainder. I added the following to my syslogd configuration and restarted syslogd.
*.OMPROUTE..* /var/log/%Y/%m/%d/omproute
The messages were then put into the file, and were like
Oct 6 11:52:19 S0W1 omproute[67174443]: EZZ7800I OMPROUTE starting Oct 6 11:52:24 S0W1 omproute[67174443]: EZZ7817I Using defined OSPF protocol 89 Oct 6 11:52:24 S0W1 omproute[67174443]: EZZ7817I Using defined OSPF protocol 89 Oct 6 11:52:24 S0W1 omproute[67174443]: EZZ7838I Using configuration file: dd:OMPCFG=USER.Z25A.TCPPARMS(OMP)
After OMPROUTE started, In this file I had 19 messages. There were 6 message on the job log.
Configuring OMPROUTE
I had a TCPIP configuration with
INTERFACE IFPORTCP6
  DEFINE IPAQENET6
  CHPIDTYPE OSD
  PORTNAME PORTCP
  INTFID 7:7:7:7
  IPADDR FE00::66:7:7:7

DEVICE PORTB MPCIPA
 LINK ETH2 IPAQENET PORTB
HOME 172.26.1.9      ETH2

DEVICE PORTA MPCIPA
 LINK ETH1 IPAQENET PORTA
HOME 10.1.1.2        ETH1
EZZ7871I NO MATCHING INTERFACE STATEMENTS FOR 172.26.1.20 (EZASAMEMVS)
EZZ8171I OMPROUTE IPV4 OSPF IS USING ASSIGNED ROUTER ID 10.1.1.2 FROM ETH1 INTERFACE
EZZ8171I OMPROUTE IPV6 OSPF IS USING CONFIGURED ROUTER ID 7.7.7.7 FROM IPV6_OSPF STATEMENT
d tcpip,,omp,ospf,list,all d tcpip,,omp,ipv6ospf,all d tcpip,,omprtoute,rttable f omproute,ospf,list,all f omproute,rttable f omproute,rt6table f omproute,IPV6OSPF,if f omproute,IPV6OSPF,list,all f omproute,IPV6OSPF,statistics f omproute,IPV6rip,list,all f omproute,ospf,nbrs
All of which will list all information about the OSPF configuration.
There are three types of resource you an display
OSPF – d tcpip,,omp,ospf,list,all or d tcpip,,omp,IPV6ospf,list,all
RIP – d tcpip,,omp,rip,list,all or d tcpip,,omp,IPV6rip,list,all
Other interface – d tcpip,,omp,generic,all or d tcpip,,omp,generic6,all
I was getting annoyed because the TCPIP NETSTAT command displays the output in line mode, and you cannot scroll back to look at it.
The documentation says you can use NETSTAT … STACK in a Rexx program, and use queued() to see how many lines were on the stack. This did not work for me. I always got 0 lines on the stack, until I exited ISPF when they all tried to execute and produced “IKJ56621I INVALID COMMAND NAME SYNTAX”.
A better (and more efficient way – you have to write less code) is create an Rexx program. I used USER.Z24C.CLIST(NS)
/* REXX */
ADDRESS ISPEXEC
'ISREDIT MACRO (a)'
x = outtrap("var.")
if a   = "" then a   = "HOME"
address TSO "netstat "a
x = outtrap("OFF")
if var.0  = 0 then exit

"ISREDIT AUTOSAVE OFF PROMPT"
do y =1 to var.0
   fn= var.y
   "ISREDIT LINE_AFTER  .ZLAST     =  (fn)"
end
If you use this command within an ISPF edit session, it will append the output to the bottom of the file.
Note: You pass parameters via ISREDIT MACRO(parms) rather than pars args parms.
You can always use DELETE ALL NX to clear the file before running the exec.
It uses AUTOSAVE OFF PROMPT, to make you explicitly save the output – or cancel from the session, and do not accidentally save it.
Extend it
As the output is in an ISPF Editor session, you can write edit macros to process the content, and filter or reformat it.
Shorthand
I extended it so I say “ns h” and it issues the netstat home command etc.
For example
'ISREDIT MACRO (a)'
if a   = "" then a  = "HOME"
else
if a = "i" then a = "devlinks (intfname ifportcp6"
else
if a = "h" then a = "home"
else
if a = "r" then a = "route addrtype  IPV6"
else
if a = "n" then a = "nd"
address TSO "netstat "a
I was asked if it was possible to connect to an ADCD system using X3270 and certificates, after quite a bit of work, the answer is yes – but it may not be easy.
The process is documented in the September version of IBM ISV zPDT Guide and Reference – which works, but the SecurePort is being removed in z/OS 2.5!
How to connect using x3270.
Using a “dialed in” local terminal into an ADCD system.
You can connect to z/OS using 3270 like terminals via a 3274 type controller and use applications like TSO. This is not a TCPIP connection, so you cannot use TLS to protect the session. These terminals are created using a Linux command like
x3270 -model 5 colin@localhost:3270 &
Where the :3270 matches the zPDT configuration statement 3270port 3270.
The colin@, known as the LUName, is put in the title of the window (so I could hot key to it, by setting key Ctrl+3 to wmctrl -a colin@).
Using X3270 and TCPIP over an insecure connection
You can connect over TCPIP into the TN3270 server using a command like
x3270 -model 5 10.1.1.2:23
This uses port 23, the standard telnet port.
You can specify an LU name – but you need to look at your TN3270 configuration to see what values have been configured. If you do not know what you are doing … it is safer to omit it.
SECUREPORT will be removed in z/OS 2.5
This was the “secure” way of providing a secure connection, before AT-TLS was developed. It is documented in Appendix E of IBM ISV zPDT Guide and Reference
The z/OS documentation says SECUREPORT will be removed
Keyword no longer supported for the TN3270E Telnet server: Removal of native TLS/SSL support from TN3270E Telnet Server, FTP Server, and DCAS.
TelnetParms         ; ATTLS defined secure port
 TTLSPort 2023      ;
 DEBUG CONN DETAIL CTRACE
 DEBUG CONN trace  CTRACE
 ConnType Secure    ; Client chooses secure or nonsecure connection.
EndTelnetParms

BeginVTAM
 Port 2023
 DEFAULTLUS
   TLS00001..TLS00030
 ENDDEFAULTLUS
 ALLOWAPPL TSO* DISCONNECTABLE ; Allow all users access to TSO
             ; applications.
             ; TSO is multiple applications all beginning with TSO,
             ; so use the * to get them all.
 ALLOWAPPL *      ; Allow all applications that have not been
                  ; previously specified to be accessed.
 USSTCP USSN
EndVTAM
Using AT-TLS
I eventually got a secure connection using AT-TLS. Many parameters need to be correct for the TLS Handshake to work. Some combinations should work – but did not.
The z/OS certificate needs CN(‘10.1.1.2’) where 10.1.1.2 is what is used by the X3270 client. It checks the value in the certificate with the value used in the connection. ALTNAME(IP(10.1.1.2)) did not work for me. If there is a mismatch you get x3270 message “hostname mismatch(62). When I used a host name of zos as in “x3270…. zos” – and the z/OS certificate has CN(‘zos’)…. it also worked.
You can use RSA, and NISTECC, certificates on z/OS.
TLS 1.2 or TLS 1.3 , RSA size 2048 or larger
TLS 1.2 or TLS 1.3, NISTECC size 521
BPECC not supported.
The CA was exported, sent down to Linux and used in the x3270 command (and also the openssl s_client command). For example -cafile ./doczosca.pem .
x3270 does not use a certificate on Linux – the doc implies it does, but nothing gets sent to the server.
In the AT-TLS configuration below,
the three cipher spec represent TLS 1.3, NISTECC and RSA.
ApplicationControlled Onis required
HandshakeRole Server is required
Below is the AT-TLS configuration for my telnet (TN…) configuration. It should work with the keyring created in Appendix E. Secure x3270 connection in IBM ISV zPDT Guide and Reference September 2022 (SG24-8205-06). See JCL. The file below is on GIT.
TTLSRule                      TN
{
  LocalPortRange              2023
  Jobname                     TN3270
  Direction                   INBOUND
  TTLSConnectionActionRef     TNCA
  TTLSGroupActionRef          TNGA
  TTLSEnvironmentActionRef    TNEA

}
TTLSConnectionAction              TNCA
{
  TTLSCipherParmsRef              TLS13TLS12
  TTLSSignatureParmsRef           TNESigParms
  TTLSConnectionAdvancedParmsRef  TNCOonAdvParms
  CtraceClearText                 Off
  Trace                           50
}
TTLSConnectionAdvancedParms       TNCOonAdvParms
{
 #ServerCertificateLabel  NISTECC521
 #ServerCertificateLabel  RSA2048
 #ccp this was added
  ApplicationControlled         On
  SSLv3          OFF
  TLSv1          OFF
  TLSv1.1        OFF
  TLSv1.2        ON
  TLSv1.3        OFF
  SecondaryMap   OFF
  HandshakeTimeout 3
}

TTLSGroupAction      TNGA
{
  TTLSEnabled        ON
  trace              50
}
TTLSKeyringParms    TNKEYRING
{
  Keyring           START1/TN3270
}

TTLSEnvironmentAction      TNEA
{
  HandshakeRole            Server
  TTLSKeyringParms
  {
#    Keyring                START1/TN3270
# Use the keyring from the ZPDT documentation chapter E
     Keyring                START1/TN3270TLSring
  }
  TTLSSignatureParmsRef    TNESigParms
}
TTLSSignatureParms         TNESigParms
{
   CLientECurves Any
}
TTLSCipherParms             TLS13TLS12
{
#TLS 1.3
 V3CipherSuites      TLS_CHACHA20_POLY1305_SHA256
#V3CipherSuites      TLS_AES_256_GCM_SHA384
#V3CipherSuites      TLS_AES_128_GCM_SHA256
#TLS 1.2
# NSTECC
 V3CipherSuites      TLS_ECDHE_ECDSA_WITH_AES_256_GCM_SHA384
#RSA
 V3CipherSuites      TLS_RSA_WITH_AES_256_CBC_SHA256
}
Although you can specify a certificate and private key on the Linux x3270 command, it does not use them. If you specify them, the certificate is not passed up to to z/OS.
The AT-TLS configuration needs TTLSEnvironmentAction -> HandshakeRole SERVER. (Despite what the documentation says). If you specify HandshakeRole ServerWithClientAuth, then z/OS expects the client to send a certificate as part of the handshake – and as x3270 does not sent a certificate – the handshake fails.
x3270 checks the host name. In the z/OS certificate the DN needs a CN matching the connection name. I connected to 10.1.1.2 – I needed SUBJECTSDN(CN(‘10.1.1.2‘) … . Without this you get hostname mismatch (62).
You should be able to specify RACDCERT …. ALTNAME(IP(10.1.1.2)), as an alternate name, but x3270 does not recognise it.
x3270 supports TLS 1.3 – if you have TLS 1.3 cipher specs configured in AT-TLS, and specify TLSv1.3 ON
X3270 supports TLS 1.2 – if you have TLS 1.2 cipher specs configured in AT-TLS, and specify TLSv1.2 ON and TLSv1.3 OFF.
x3270 sends up a list of cipher suites it will accept. The first three are TLS 1.3 (TLS_AES_256_GCM_SHA384 (0x1302) ,TLS_CHACHA20_POLY1305_SHA256 (0x1303),TLS_AES_128_GCM_SHA256 (0x1301).
When configuring TN3270 use V3CipherSuites not V3CipherSuites4char. V3CipherSuites takes 2 character strings and long TLS_… strings. V3CipherSuites4char only take 4 character strings, and not TLS_… strings.
If you change the PAGENT configuration you need F PAGNET,UPDATE to pick up the changes.
If you make a change to the PAGENT configuration, it does not always report problems. You should use Unix command commands like pasearch -t -f TN 1>a … oedit a to display the TTLS configuration for rule TN, and edit the file to check.
If you change a keyring, you need F PAGENT,REFRESH to pick up the change.
When you start PAGENT use the -l /var/log/pagent.log -d1 options (or similar). Review the /var/log/pagent.log file and check for “WARNING” and “ERR”
The PAGENT configuration can have the same parameter specified at the environment level and at the connection level. The pasearch -t -f TN command displays both sets of data … you have to be careful you are checking the right set of data.
Is the port active?
Check the port is being listened to
tso netstat conn ( port 2023
gave
EZZ2585I User Id  Conn     Local Socket           Foreign Socket         State
EZZ2586I -------  ----     ------------           --------------         -----
EZZ2587I TN3270   0000000B 0.0.0.0..2023          0.0.0.0..0             Listen
Showing the port is in Listen state from jobname TN3270 (which has userid TCPIP!)
Update to show it not working!
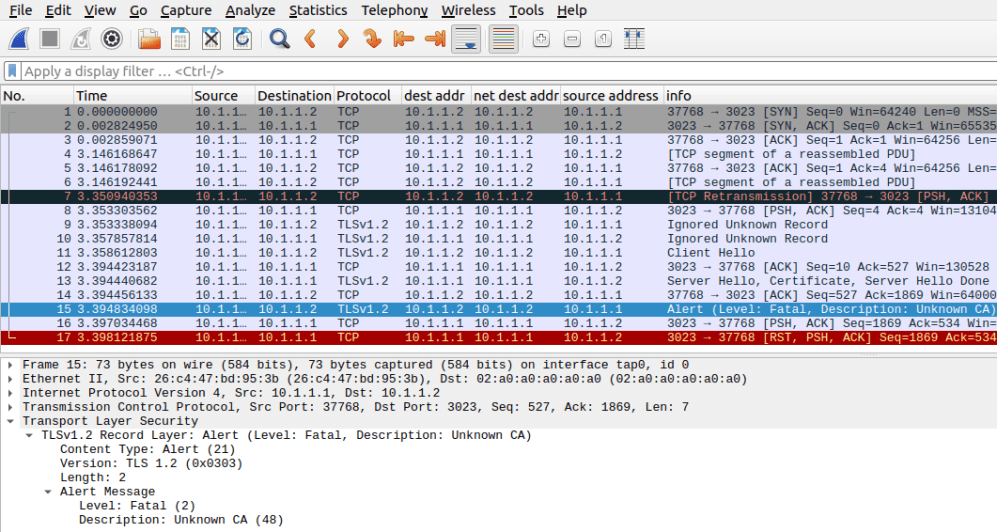
I was asked a question about AT-TLS, and it not working. I thought it would be useful to include some Wireshark output to help people to see what is happening.
I used x3270 10.1.1.2@3023 and it reported “SSL: Host certificate verification failed: self signed certificate in certificate chain”.
In the examples below there are three records of interest
Client Hello – this is the first step in the handshake. If you do not have this – your client is not sending a request
Server Hello – the back-end has processed the Client-Hello – and, in the example below, sends down a certificate
Alert (from the client). The client cannot validate the certificate because it does not have the CA for the certificate.
The Wireshark trace was
The important line is the “Client Hello” in blue. This is the start of the TLS handshake. In my case the length is 512 bytes. I would expect any TLS handshake to be a couple of hundred bytes long. If you do not get a “Client Hello”, your client is not set up for TLS/SSL.
The “Server Hello” line is where the server is responding (with a certificate).
There is an error “Alert (Level: Fatal Description: Unknown CA”
The Communications Server’s policy server allows you to define policies for: (the list below is mainly taken from the IBM documentation)
QoS: The overall Quality of Service provided to applications or users, in terms of elements such as throughput and delay. It might be critical to provide Business Application traffic better service during peak hours than that of FTP or web traffic.
IDS: Intrusion Detection Services provides the following support: scan detection and reporting, attack detection, reporting, and prevention, traffic regulation for TCP connections and UDP receive queues. You can use IDS policies to specify event conditions and the actions to take for particular events
IPSec: IP Security policy can be used for the following protection:
Protect a secure host on an internal network from unwanted network traffic
Provide protection for traffic between partner companies over connected networks
Allow secure sending of data over the Internet by providing IPSec virtual private network (VPN) support
Routing: Policy conditions consist of a variety of selection criteria that act as filters for policy-based routing (Routing) rules. Traffic can be filtered based on source addresses, destination addresses, source port range, destination port range, protocol, job name, security zone, and security label.
AT-TLS: (Application Transparent-Transport Layer Security) Provides TLS support at the TCPIP level (below the application). Using AT-TLS means applications do not need to be changed to support TLS.
The PAGENT (Policy Agent) started task runs the policy server. It can use local configuration files, or data in LDAP.
Using AT-TLS
It was a struggle to get a secure connection using AT-TLS and x3270. Many parameters need to be correct for the TLS Handshake to work. Some combinations should work – but did not, the documentation is not 100% correct. When I knew what the correct parameters were, the configuration was pretty easy! The configuration technique looks as if it was designed for a baby system. It is not easy to follow good housekeeping, and change management practices, which made the overall experience harder than I expected.
X3270 requirements
x3270 is a 3270 emulator. It can use TLS to provide a secure connection to z/OS. Although you can specify a certificate for X3270 to use – x3270 does not used the client certificate.
At a high level, the TLS flow between x3270 and AT-TLS is:
X3270 client sends a “client-hello” request to the server. This includes what levels of TLS are supported (TLS 1.2, TLS 1.3), and the cipher specs it supports (what encryption type,what checksum algorithm etc)
The server (Pagent) matches the information sent in the “Client-hello” with its configuration. For example, select a certificate which matches the encryption type, and finds a common cipher spec.
If there is an acceptable certificate, and cipher spec, the selected certificate and selected cipher spec are sent down to the client (“server hello”).
The x3270 client checks that the certificate is acceptable – the CN in the certificate matches the address of the server. (CN(10.1.1.2) matches the IP address 10.1.1.2).
If client authentication is requested, then the client sends its certificate to the server. This is not supported by X3270, and the server has to be configured with HandshakeRole Server.
X3270 initially sends that it can support TLS 1.2 and TLS 1.3, and a variety of cipher specs.
TN3270 requirements
Not all certificates worked. I could only get certificates to work with
RSA key size >= 2048
NISTECC keysize >= 521
To AT-TLS, this is just a certificate name in a keyring.
In the AT-TLS configuration
ApplicationControlled On is required. This allows TN3270 to interact with AT-TLS, for example display the cipher spec being used.
HandshakeRole Server is required.
It needs a keyring, and access to the private part of the certificate. For example CONTROL access to the RACF profile userid.ring.LST int the RDATALIB class.
Certificates
If you do not specify a certificate – it takes the keyring default.
You can specify a(one) certificatelabel.
You can specify multiple ServerCertificateLabel statements. With this you can support different certificate types, and support migration to newer certificates.
AT-TLS configuration – in general
The Communications Server as a group of products, do not have a consistent way of configuring the individual components. For example some use # as a comment delimiter, other products use ; . Configuring the Policy Server is not difficult – just different, and does not behave as other z/OS components do, or as I expected.
File USER.Z24C.TCPPARMS(PAGENTT) has the configuration for one TCPIP image.
TTLSConfig //'USER.Z24C.TCPPARMS(PAGENTTN)' FLUSH PURGE
TTLSRULE ... #and other inline definitions

QOSConfig  //'USER.Z24C.TCPPARMS(PAGENTQ1)' FLUSH PURGE
policyAction  ...  # and other inline QOS definitions

# and similarly for IDS, IPSec,Routing etc
You are allowed one TTLSConfig statement per TCPIP file. If you have multiple, only the last one will be used. You can have multiple TTLSRULE statements.
How the configuration works
Within a file, if you have a set of definitions with the same name, the last one will be used. For example
The keyring will be START2/TN3270 and Trace is not specified.
If you use Unix command pasearch -t , it will show keyring:START2/TN3270 and no trace statement in that section. Definitions with the same name are replaced, not merged.
Having just one TTLSCONFIG file makes it harder to manage. I would like to be able to have a configuration file for each port, or have all of the TLSRULEs in one file, and TTLSCipherParms in another file, and so on. It would make it easier to manager, and perform change management on the files.
The configurations from tcpImage TCPIP2 and tcpImage TCPIP2 are isolated from each other. If you want to use common definitions between tcpImages, put them in CommonTTLSConfig file.
The commonTTLSConfig statements are processed before the tcpImage statements, so a definition set in the tcpImage file will take precedence over a common definition.
The commonTTLSConfig file seems to need to be self consistent. I added
The allows you to create a “subroutine” out of the cipherspecs. It also allows you to use the same definitions in multiple places.
Within a TCPIPIMAGE configuration
The same parameter can be specified in more than one configuration statement. The documentation says:
For parameters that can be specified in multiple action types, the value used by a connection is determined by the following hierarchical rule set, they first found is used.
If the parameter is specified in the TTLSConnectionAction statement that is the value used.
If the parameter is specified in the TTLSEnvironmentAction statement that is the value used.
If the parameter is specified in the TTLSGroupAction statement that is the value used.
If a default value is defined, that is the value used.
No value is used by AT-TLS and no parameter is explicitly passed to System SSL.
Because of the order, Scope:Connection takes precedence over Scope:Environment, the three cipher specs will be used.
When configuring AT-TLS I found it easiest if I used the Unix commands pasearch -t -f TN 1>a; oedit a and specify the rule name I was interested in (TN), then search for the last instance of the attribute of interest
PDSE or Unix file?
If you configuration is in Unix files, then you can get AT-TLS to reread this on regular basis – typically half an hour. This is useful of you want changes to be picked up automatically, but not if you want strict change control management.
AT-TLS configuration for TN3270
Below is the AT-TLS configuration for my telnet (PAGENTTN…) configuration.
TTLSRule                      TN
{
  LocalPortRange              2023
  Jobname                     TN3270
  Direction                   INBOUND
  TTLSConnectionActionRef     TNCA
  TTLSGroupActionRef          TNGA
  TTLSEnvironmentActionRef    TNEA

}
TTLSConnectionAction              TNCA
{
  TTLSCipherParmsRef              TLS13TLS12
  TTLSSignatureParmsRef           TNESigParms
  TTLSConnectionAdvancedParmsRef  TNCOonAdvParms
  CtraceClearText                 Off
  Trace                           50
}
TTLSConnectionAdvancedParms       TNCOonAdvParms
{
 ServerCertificateLabel  NISTECC521
 ServerCertificateLabel  RSA2048
#ccp this was added
  ApplicationControlled         On
  SSLv3          OFF
  TLSv1          OFF
  TLSv1.1        OFF
  TLSv1.2        ON
  TLSv1.3        OFF
  SecondaryMap   OFF
  HandshakeTimeout 3
}

TTLSGroupAction      TNGA
{
  TTLSEnabled        ON
  trace              50
}
TTLSKeyringParms    TNKEYRING
{
  Keyring           START1/TN3270
}

TTLSEnvironmentAction      TNEA
{
  HandshakeRole            Server
  TTLSKeyringParms
  {
    Keyring                START1/TN3270
  }
  TTLSSignatureParmsRef    TNESigParms
}
TTLSSignatureParms         TNESigParms
{
   CLientECurves Any
}
TTLSCipherParms             TLS13TLS12
{
#TLS 1.3
 V3CipherSuites      TLS_CHACHA20_POLY1305_SHA256
#V3CipherSuites      TLS_AES_256_GCM_SHA384
#V3CipherSuites      TLS_AES_128_GCM_SHA256
#TLS 1.2
# NSTECC
 V3CipherSuites      TLS_ECDHE_ECDSA_WITH_AES_256_GCM_SHA384
#RSA
 V3CipherSuites      TLS_RSA_WITH_AES_256_CBC_SHA256
}
If you do not specify a certificate label in the configuration, AT-TLS takes the default from the keyring.
You can specify a certificate label using CertificateLabel…
If you want to specify more than one Certificate label – for example you are migrating from one certificate to another, or you want to support an RSA certificate and an Elliptic Curve certificate then specify one or more ServerCertificateLabel … statements.
Some lessons learned
When configuring TN3270 use V3CipherSuites not V3CipherSuites4char. V3CipherSuites takes 2 character identifiers and long TLS_… strings. V3CipherSuites4char only take 4 character identifiers , and not TLS_… strings.
If you change the PAGENT configuration you need F PAGNET,UPDATE to pick up the changes.
If you make a change to the PAGENT configuration, it does not always report problems. You should use Unix command commands like pagent -t -f TN 1>a ;oedit a to display the TTLS configuration for rule TN, and edit the file to check.
If you change a keyring, you need F CPAGENT,REFRESH to pick up the change.
When you start PAGENT use the -l /var/log/pagent.log -d1 options. Review the /var/log/pagent.log file and check for “WARNING” and “ERR”
The PAGENT configuration can have the same parameter specified at the environment level and at the connection level. The pasearch -t -f TN command displays both sets of data … you have to be careful you are checking the right set of data.
PAGENT does not report if a section was skipped. I had two TTLSConfig statements in a TCPIP image file, and only the last one was used.
You need the syslogd daemon running to capture error messages in a file.
General PAGENT commands
See here for starting PAGENT (and the trace levels you can use).
Updating PAGENT
If you change the PAGENT configuration (my job is CPAGENT) you can use
F CPAGENT,UPDATE
To refresh the configuration,
F CPAGENT,REFRESH
to refresh the configuration and restart processing. Existing sessions will continue unchanged.
When configuring TN3270 you can use the Unix command pasearch -t -f TN 1>a to display just the TLS policy you are interested in (TN) .
Displaying information
You display configuration information using the Unix command pasearch…