Destination unreachable, Port unreachable. Which firewall rule is blocking me?

I was trying to connect an application on z/OS through a server to my laptop – so three systems involved.

On the connection from the server to my laptop, using Wireshark I could see no traffic from the application.

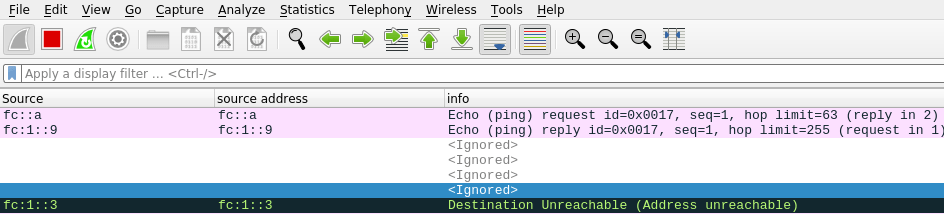
When I used Wireshark on the z/OS to server connection I got

   Source   Destination port Protocol info 
>1 10.1.1.2 10.1.0.2 2175 TCP ..
<2 10.1.1.1 10.1.1.2 2175 ICMP Destination unreachable (Port unreachable)

This means

  1. There was a TCP/IP Packet from 10.1.1.2 (z/OS) to 10.1.0.2 (mylaptop) port 2175
  2. Response:Destination unreachable (Port unreachable)

This was a surprise because I could ping from z/OS through the server to the laptop.

Looking in the firewall log ( /var/log/ufw.log) I found

[UFW BLOCK] IN=tap0 OUT=eno1 MAC=... SRC=10.1.1.2 DST=10.1.0.2 ... PROTO=TCP SPT=1050 DPT=2175 ...

This says

  • Packet was blocked. When using the ufw firewall – all of its messages and definitions contain ufw.
  • From 10.1.1.2
  • To 10.1.0.2
  • Source port 1050
  • Destination port 2175

With the command

sudo ufw route allow in on tap0 out on eno1

This allows traffic to be routed through this node from interface tap0 to interface eno1, and solved my problem.

What caused the problem?

iptables allows the systems administrator to define rules (or chains of rules – think subroutines) to control the flow of packets through the Linux kernel. For example

  • control input input packets destined for this system
  • control output packets from this system
  • control forwarded packets flowing through this system.

ufw is an interface to iptables which makes it easier to define rules.

You can use

sudo ufw status

to display the ufw definitions, for example

To                         Action      From
-- ------ ----
22/tcp ALLOW Anywhere
Anywhere on eno1 ALLOW Anywhere
Anywhere on tap0 ALLOW Anywhere (log) # ‘colin-ethernet’

You can use

sudo iptables -L -v

to display the iptables. The -v options show you how many times the rules have been used.

sudo iptables-save reports on all of the rules. For example (a very small subset of my rules)

-A FORWARD -j ufw-before-forward
-A ufw-before-forward -j ufw-user-forward
-A ufw-user-forward -i tap0 -o eno1 -j ACCEPT
-A ufw-user-forward -i eno1 -o tap0 -j ACCEPT

-A ufw-skip-to-policy-forward -j REJECT --reject-with icmp-port-unreachable

Where

  • -A FORWARD.… says when doing forwarding use the rule (subroutine) called ufw-before-forward. You can have many of these statements
  • -A ufw-before-forward -j ufw-user-forward add to the end of subroutine ufw-before-forward, call (-jump to) subroutine ufw-user-forward
  • -A ufw-user-forward -i tap0 -o eno1 -j ACCEPT in subroutine ufw-user-forward, if the input interface is tap0, and the output interface is eno1, then ACCEPT the traffic, and pass it on to interface eno1.
  • -A ufw-user-forward -i eno1 -o tap0 -j ACCEPT in subroutine ufw-user-forward, if the input interface is eno1, and the output interface is tap0, then ACCEPT the traffic, and pass it on to interface eno1.
  • -A ufw-skip-to-policy-forward -j REJECT –reject-with icmp-port-unreachable. In this subroutine do not allow the packet to pass through, but send back a response icmp-port-unreachable. This is the response I saw in Wireshark.

With -j REJECT you can specify

icmp-net-unreachable
icmp-host-unreachable
icmp-port-unreachable
icmp-proto-unreachable
icmp-net-prohibited
icmp-host-prohibited
icmp-admin-prohibiteda

The processing starts at the top of the tree and goes into each relevant “subroutine” in sequence till it finds and ACCEPT or REJECT.

If you use sudo iptables -L -v it lists all the rules and the use count. For example

Chain FORWARD (policy DROP 0 packets, 0 bytes)
pkts bytes target prot opt in out source destination
...
259 16364 ufw-before-forward all -- any any anywhere anywhere

Chain ufw-before-forward (1 references)
pkts bytes target prot opt in out source destination
...
77 4620 ufw-user-forward all -- any any anywhere anywhere

Chain ufw-user-forward (1 references)
pkts bytes target prot opt in out source destination
0 0 ACCEPT all -- eno1 tap2 anywhere anywhere
0 0 ACCEPT all -- tap2 eno1 anywhere anywhere
9 540 ACCEPT all -- tap0 eno1 anywhere anywhere
0 0 ACCEPT all -- eno1 tap0 anywhere anywhere

Chain ufw-reject-forward (1 references)
pkts bytes target ...
45 2700 REJECT ... reject-with icmp-port-unreachable
  • For the packet forwarding it processed a number of “rules”
    • 259 packets were processed by subroutine ufw-before-forward
  • Within ufw-before-forward, there were several calls to subroutines
    • 77 packets were processed by subroutine ufw-user-forward
  • Within ufw-user-forward the line (in bold) said there were 9 packets, which were forwarded when the input interface was tap0 and the output was eno1.
  • Within the subroutine ufw-reject-forward, 45 packets were rejected with icmp-port-unreachable.

The ufw-reject-forward was the only instance of icmp-port-unreachable with packet count > 0. This was the rule which blocked me.

Log file

In the /var/log/ufw.log was an entry for [UFW BLOCK] for the address and port,

wireshark not working across an x11 session

I tried to use wireshark using a remote logon to a system. This failed with

This application failed to start because no Qt platform plugin could be initialized. Reinstalling the application may fix this problem.

There was an easy fix.

ssh -X u350@10.1.0.5

Use the -X option – simple.

I also saw references to the file/etc/ssh/sshd_config on the remote machine and the file needing X11Forwarding yes

If you use the following in a command window

echo $DISPLAY

it should say something like

localhost:10.0

zWireshark – capturing TCPIP trace on z/OS and displaying it in wireshark.

For example, a ping to z/OS as seen by z/OS

The TCPTRACE module runs as a batch job. It uses a documented TCPIP interface to collect packet trace data. It writes the trace data to a file which can be downloaded and used as input to wireshark.

Using the TCPTRACE module, you submit the job, run your test. Stop the job, download the file. Simple.

The documented way to collect a trace from z/OS is 

  • Start a CTRACE trace writer
  • Start CTRACE
  • Start TCP trace
  • Run your test
  • Stop TCP trace
  • Stop Ctrace
  • Stop Trace writer 
  • use IPCS to process the trace and create a file to download
  • Download the file

Which is complex and has many steps.

Ive created a github project called zWireshark. You only need the load module, the source is there for example.

Please let me know of any suggestions or improvements.

Understanding a Wireshark TLS handshake trace

I’ve done a lot of work using TLS, and Wireshark is a great tool for displaying the flows of data. The problem is understanding what the output shows! This blog post shows what to look at.

Note: Flows with GREASE values should be ignored. This is designed to make sure the remote end can handle unexpected values, by sending up unsupported values.

Summary of the flows of the handshake

See here for an overview.

  • Client to Server: Client Hello
  • Server to Client: Server Hello, Certificate, Server Key Exchange, Certificate Request, Server Hello Done
  • Client to Server: Certificate, Client Key Exchange, Certificate Verify, Change Cipher Spec, Finished
  • Server to Client: Change Cipher Spec
  • Server to Client: Finished

Client to Server: Client Hello

This displays

Transport Layer Security
    TLSv1.2 Record Layer: Handshake Protocol: Client Hello
        Content Type: Handshake (22)
        Version: TLS 1.0 (0x0301)
        Handshake Protocol: Client Hello
            Handshake Type: Client Hello (1)
            Version: TLS 1.2 (0x0303)
            Random: c5ec1cf320f2f77ba6f3f84e7fd7d1f946400484a56918a5e499b0e98be2a07f
            Session ID Length: 32
            Session ID: a839f3fcd1d7f4394c6e5bd0279da5c75458b8a81f35c5890107007cc921fa7b
            Cipher Suites Length: 32
            ▶Cipher Suites (16 suites)
            Compression Methods Length: 1
            ▶Compression Methods (1 method)j             
            Extensions Length: 429
            ▶Extension: signature_algorithms 
            Extension: Reserved (GREASE) (len=0)
            ▶Extension: supported_versions (len=7)
            ...

If you expand supported versions you get

 Extension: supported_versions (len=7)
       ...
       Supported Version: TLS 1.3 (0x0304)
       Supported Version: TLS 1.2 (0x0303)

Which shows you the TLS versions that the client supports.

If you expand Cipher Specs you get

Cipher Suites (16 suites)
   Cipher Suite: TLS_AES_128_GCM_SHA256 (0x1301)
   Cipher Suite: TLS_AES_256_GCM_SHA384 (0x1302)
   Cipher Suite: TLS_CHACHA20_POLY1305_SHA256 (0x1303)
   Cipher Suite: TLS_ECDHE_ECDSA_WITH_AES_128_GCM_SHA256 (0xc02b)
   Cipher Suite: TLS_ECDHE_RSA_WITH_AES_128_GCM_SHA256 (0xc02f)
   ...		        

This is the list of cipher specs in preference order, that the client supports.

The signature_algorithms defines which signature and hash algorithms are supported for the server’s digital certificate.

Server to Client: Server Hello, Certificate, Server Key Exchange, Certificate Request, Server Hello Done

The server sends down several blocks of data. These are logically distinct blocks of data – but tend to arrive in one block.

  • Server Hello, Here are some parameters for the handshake
  • Certificate, Here is my certificate(s)
  • Server Key Exchange,
  • Certificate Request, Please send me a certificate matching the enclosed parameters
  • Server Hello Done

Server to Client: Server Hello

Handshake Protocol: Server Hello
  Handshake Type: Server Hello (2)
  Version: TLS 1.2 (0x0303)
  Random: ...
  Session ID Length: 32
  Session ID: ...
  Cipher Suite: TLS_ECDHE_ECDSA_WITH_AES_128_GCM_SHA256 (0xc02b)
  ...  

It shows which version of TLS has been picked.

The Cipher Suite is the value picked by the server.

Server to Client: Certificate

This is present if the server is configured to send down the server’s certificate.

Handshake Protocol: Certificate
  Handshake Type: Certificate (11)
     ...
     Certificates Length: 1608
       Certificates (1608 bytes)
          Certificate Length: 734
          ▼Certificate: .. (commonName=10.1.1.2,...organizationName=NISTECCTEST)
             ▶signedCertificate
                serialNumber: 0x7a
                ▶signature (sha256WithRSAEncryption)
                ▶issuer: ...
                ▶validity ...
                ▼subject: rdnSequence (0)
                   RDNSequence (organizationName=NISTECCTEST)
                   RDNSequence (organizationalUnitName=SSS)
                   RDNSequence (commonName=10.1.1.2)
                ▶subjectPublicKeyInfo
                ▶extensions: 5 items
                algorithmIdentifier (sha256WithRSAEncryption)
                    ...
          Certificate Length: 868
          ▶Certificate:  ...

From this we can see the certificates sent down from the server.

  • The certificate name is specified at many levels; including on the Certificate and subject.
  • The CA (issuer) which signed each certificate.
  • The validity dates of the certificate
  • The extensions, which include how the certificate can be used; key usage, Subject Alternative Name ( IP address) etc.

Check this is what you are expecting, and that the CA is in your trust store.

Server to Client: Server Key Exchange

I have never used the information in this area

Server to Client: Certificate Request

Handshake Protocol: Certificate Request
   Certificate types count: 3
      ▼Certificate types (3 types)
         Certificate type: RSA Sign (1)
         Certificate type: ECDSA Sign (64)
         Certificate type: DSS Sign (2)
      ▼Signature Hash Algorithms Length: 26
         Signature Algorithm: rsa_pkcs1_sha512 (0x0601)
         Signature Algorithm: ecdsa_secp521r1_sha512 (0x0603)
         ... 
      ▼Distinguished Names Length: 246
         Distinguished Names (246 bytes)
             Distinguished Name: (commonName=COLIN4Certification Authority,...)
             Distinguished Name: (commonName=DocZosCA,...)
             Distinguished Name: (commonName=SSCA256...)

This is saying please send me a certificate:

  • The certificate must be one of certificate-type elements; RSA, ECDSA or DSS,
  • and signed by one of the algorithms listed,
  • and have a CA signer of COLIN4Certification Authority…, DocZosCA… or SSCA256… .

The CA signers are taken from the server’s trust store.

Server to Client: Server Hello Done

That’s the server side of the work done… almost

Client to Server: Certificate, Client Key Exchange, Certificate Verify, Change Cipher Spec, Finished

Client to Server: Certificate

The client needs to pick a certificate from those in its key store. Depending on the application

  • a browser may display a list of valid certificates for the end user to select
  • a program may use the information sent down in the handshake to pick the best certificate
  • a program may return what the configuration specified (such as default)
  • a program may just return the first certificate in the key file.
Handshake Protocol: Certificate
   Handshake Type: Certificate (11)
   Certificates Length: 683
   ▼Certificates (683 bytes)
     Certificate Length: 680
     ▼Certificate: … (commonName=docec384,...countryName=GB)
       ▼signedCertificate
          serialNumber: 0x029b
          ▶signature (ecdsa-with-SHA384)
          ▼issuer: rdnSequence (0)
          ▶rdnSequence: 4 items (commonName=SSCA256,OU=CA,iO=DOC,C=GB)
            ....
          ▶validity...
          ▼subject: rdnSequence (0)
              ▶RDNSequence item: 1 item (countryName=GB)
              ▶RDNSequence item: 1 item (organizationName=Doc2)
              ▶RDNSequence item: 1 item (commonName=docec384)
          ▶subjectPublicKeyInfo
          ▶extensions: 6 items...
          algorithmIdentifier (ecdsa-with-SHA384)
          ...

We can see

  • the algorithm identifier is ecdsa-with-SHA384 which is OK
  • the issuer is CN=SSA256,ou=CA,C=GB which is in the list of CAs passed from the server.
  • the signature is ecdsa – which is OK

Client to Server: Client Key Exchange

I haven’t used this. If the handshake gets this far, the set-up is good.

Client to Server: Certificate Verify

I have never used this. It is used to send up some data encrypted with the client’s private key, to check the server can decrypt it.

Client to Server: Change Cipher Spec

Response to the server. I have never used this. Business as usual, it periodically changes the Cipher Spec

Finished

Server to Client: Change Cipher Spec

Each direction has its own cipher spec. This is the server saying to the client … ok… I’m using the new cipher spec.

Server to Client: Finished

The final – final completion.

Problems

When an invalid CA was used at the client end, the server sent down

Transport Layer Security
    TLSv1.2 Record Layer: Alert (Level: Fatal, Description: Unknown CA)
        Content Type: Alert (21)
        Version: TLS 1.2 (0x0303)
        Alert Message
            Level: Fatal (2)
            Description: Unknown CA (48)

This has a list of the codes and their meaning.

Understanding ping and why it does not answer.

I’m sure every one reading this post has the kindergarten level of knowledge of ping (when it works), the hard part is when ping does not work. Ping can do so much more.

Pinging 101

If you successfully ping an IP address you get a response like

PING 2001:db8::7(2001:db8::7) 56 data bytes
64 bytes from 2001:db8::7: icmp_seq=1 ttl=64 time=0.705 ms
64 bytes from 2001:db8::7: icmp_seq=2 ttl=64 time=0.409 ms

First steps

For the ping to be successful the ping has to get to the remote end, and the response needs to get back to the originator. This has two implications (which are obvious once you understand)

  • At each hop the node needs to know how to get to the destination.
  • At each hop the node needs to know how to get to the originator.

If the remote end does not have a routing definition to get to the originator, the response will get thrown away, and your ping will time out.

Did it leave/arrive in mybox?

Depending on how heavily used your system is displaying the number of bytes and packets sent over an interface may be of some help. If the number is zero, then the interace was not used. If the number is non zero, this could be caused by your ping, or by some other traffic.

Using TSO NETSTAT DEVLINKS and a ping -c1 192.168.1.74 (for one ping)

The statistics for the interface showed a change

BytesIn                           = 116
Inbound Packets                   = 1 
...
BytesOut                          = 116
...

Forwarding

If the route is through servers, then the servers need to be enabled for forwarding. For example

  • Linux: sudo sysctl -w net.ipv6.conf.all.forwarding=1
  • z/OS: IPCONFIG DATAGRAMFWD

If forwarding is not specified, the ping request will come in on one interface and be thrown away.

Pinging to a multicast address

With multicast you can send the same data to multiple destinations on a connection(interface), or on a host.

You can issue

ping ff02::1%tap1

where

  • ff02::1 is an IP V6 multi cast address – ff02 is for everything on this link
  • %tap1 says use the interface tap1. Without it, ping does not know which link to send it to.

Wireshark shows the source was fe80::5460:31ff:fed4:4587 which is the address of the interface used to send out the request.

The output was

PING ff02::1%tap1(ff02::1%tap1) 56 data bytes
64 bytes from fe80::5460:31ff:fed4:4587%tap1: icmp_seq=1 ttl=64 time=0.082 ms
64 bytes from fe80::7:7:7:7%tap1: icmp_seq=1 ttl=255 time=3.36 ms (DUP!)
64 bytes from fe80::5460:31ff:fed4:4587%tap1: icmp_seq=2 ttl=64 time=0.082 ms
64 bytes from fe80::7:7:7:7%tap1: icmp_seq=2 ttl=255 time=3.01 ms (DUP!)
64 bytes from fe80::5460:31ff:fed4:4587%tap1: icmp_seq=3 ttl=64 time=0.083 ms
64 bytes from fe80::7:7:7:7%tap1: icmp_seq=3 ttl=255 time=3.22 ms (DUP!)

The z/OS host, has two IP addresses for the interface – and both of them replied.

Pinging from a different address on the machine

I had a server where there as

  • an Ethernet connection to my laptop. The server end of the connection had address 2001:db8::2
  • an Ethernet like connection to z/OS running through a tunnel. The device (interface) was called tap1.

To ping to the multicast address, as if it came from 2001:db8::2, the address of an Ethernet connection on the same machine, you can use

ping -I 2001:db8::2 ff02::1%tap1

Wireshark shows the source was 2001:db8::2.

The output was

PING ff02::1%tap1(ff02::1%tap1) from 2001:db8::2 : 56 data bytes
64 bytes from 2001:db8:1::9: icmp_seq=1 ttl=255 time=3.15 ms
64 bytes from 2001:db8:1::9: icmp_seq=2 ttl=255 time=1.22 ms
64 bytes from 2001:db8:1::9: icmp_seq=3 ttl=255 time=3.21 ms

without the duplicate responses (I do not know why). (It may be due to the global address 2001… compare with the link-local address 9e80…)

You might use this ping from a different address when checking a firewall. The firewall may be restricting the source of a packet.

The problems of ping using a different address on the machine

I had a wireless connection, and an Ethernet connection to my laptop. If I pinged through my server to z/OS, the “return address” was from the wireless connection. z/OS was not configured for this, so the reply to the ping was lost.

Even trying to force the interface id to use with

ping -I enp0s31f6 2001:db8:1::9

The wireless connection was chosen, and ping gave a message

ping: Warning: source address might be selected on device other than: enp0s31f6

I had to give my Ethenet connection an address, and change the route to add the src

sudo ip -6 addr add 2001:db8::7 dev enp0s31f6

sudo ip route replace 2001:db8:1::/64 via fe80::a2f0:9936:ddfd:95fa dev enp0s31f6 … src 2001:db8::7

Only then did the ping request get to z/OS – but z/OS did not know how to get back to my laptop!

A normal Wireshark trace

This shows the request and the reply.

Why can ping fail?

If you only get the request data in the Wireshark trace, this means no reply was sent back.

This could be for many reasons including

  • The IP address (2001:db8::1:0:0:9 in the wireshark output above) could not be reached. This could be due to
    • A fire wall dropped it
    • It could not be routed on
    • The address did not exist
  • The response could not be sent back
    • A firewall blocked it
    • There is no routing from the destination back to the originator
    • There is no routing on an intermediate hop

Example of failure

I had a radvd configuration which included

prefix 2001:db8:0:0:1::/64

   {
     AdvOnLink on;
     AdvAutonomous on;
     AdvRouterAddr on;

   };  

   route 2001:db8::/64
   {
     AdvRoutePreference medium;
     AdvRouteLifetime 3100;
   
   };

The 2001:db8:0:0:1::/64 says traffic for 2001:db8:0:0 is on this system, and traffic for 2001:db8::/64 is off this host.

When ping tried to reply – it tried to send the packet to 2001:db8::/64 – which was routed to the same host and so IP just dropped the packet.

I needed 2001:db8:0:0:1::/80. This says traffic for 2001:db8:0:0:1 is on this system. I also used 2001:db8::/80 which is 2001:db8:0:0:0/80 is off this host. The /80 gave the finer granularity.

Once you know these things, it is obvious. This is called experience.

Another example of a failure

As part of writing up another blog post, I created my network to use only address fc00:…

With this, ping failed to work.

The reason for this was that at the back-end, I could see the source was an 2001:db8:… address, which was not configured in my back-end.

On my front end system my Ethernet device had

2: enp0s31f6: <BROADCAST,MULTICAST,UP,LOWER_UP> mtu 1500 state UP qlen 1000
    inet6 fc::7/128 scope global 
       valid_lft forever preferred_lft forever
    inet6 2001:db8::4cca:6215:5c30:4f5e/64 scope global temporary dynamic 
       valid_lft 84274sec preferred_lft 12274sec
    inet6 2001:db8::51d8:9a9f:784:3684/64 scope global dynamic mngtmpaddr noprefixroute 
       valid_lft 84274sec preferred_lft 12274sec
    inet6 fe80::9b07:33a1:aa30:e272/64 scope link noprefixroute 
       valid_lft forever preferred_lft forever

I deleted this using

sudo ip -6 addr del 2001:db8::4cca:6215:5c30:4f5e/64 dev enp0s31f6

and ping worked!

When I added it back in, ping continued to work. I cannot find which interface address ping uses.

Of course I could have used

ping -I fc::7  fc:1::9

to which interface address to use!

A failure with a hint

I had a WiresShark output

The destination Unreachable had

Internet Control Message Protocol v6
    Type: Destination Unreachable (1)
    Code: 3 (Address unreachable)
    ...
    Internet Protocol Version 6, Src: fc:1::9, Dst: fc::a
    Internet Control Message Protocol v6

This is saying that at the server end of the link to z/OS, where the server end had address fc:1::3 ( see the data at the start of the black line) was unable to deliver the packet to dst: fc::a. This shows the problem is with the server in the middle rather than z/OS.

The solution turned out to be more complex than I first though.

I tried

sudo ip -6 route add fc::/64 dev eno1 via fc::7

but this gave

RTNETLINK answers: No route to host

On the laptop I did

ip -6 addr

which gave me

enp0s31f6: <BROADCAST,MULTICAST,UP,LOWER_UP> mtu 1500 state UP qlen 1000
    inet6 fc::7/128 scope global 
       valid_lft forever preferred_lft forever
    inet6 fe80::9b07:33a1:aa30:e272/64 scope link noprefixroute 
       valid_lft forever preferred_lft forever

back on the server I replaced fc::7 with fe80::9b07:33a1:aa30:e272

sudo ip -6 route add fc::/64 dev eno1 via fe80::9b07:33a1:aa30:e272

and then ping worked!

Digging into this I found the documentation on Neighbourhood discovery section 8 says

For static routing, this requirement implies that the next- hop router’s address should be specified using the link-local address of the router.

Sometimes

sudo ip -6 route add fc::/64 dev eno1 via fc::7

worked fine. ip -6 route gave

fc::7 dev eno1 metric 1024 pref medium
fc::/64 via fc::7 dev eno1 metric 1024 pref medium
fc:1::/64 dev tap1 metric 1024 pref medium

I think this just goes to show that this is a complex area, and there are things happening which I do not understand.