Using webLogic web server and the IBM MQ resource adapter.

Ive documented the steps I took to configure webLogic to use the IBM MQ Resource Adapter, so I could use connection pools and avoid 1 million MQCONNs a day.
The document grew and grew, and I found it easiest to create a PDF document, here.

The document covers

  • Getting the IBM Resource Adapter from IBM
  • Adding the webLogic specific file into the Resource Adapter.
  • Deploying the resource adapter
  • Adding additional configurations to the Resource Adapter
  • Changing your MDB deployment to use the Resource Adapter instead of native JMS
  • How  you tell if a connnectionFactory is using the Resource Adapter and not native JMS.

I provide a sample weblogic-ra file to get you started.

Making MQ swing with Spring. Tuning Camel and Spring (to get rid of the 1 second wait in every message).

Spring is a framework which sits on top of Apache Camel, which runs on Oracle WebLogic web server.   It simplifies writing java applications for processing messages.

I was involved in tracking down some performance problems when the round trip time for a simple application was over 1 second – coming from a z/OS background I thought 50 milliseconds was a long time – so over 1 second is an age!

The application is basically a Message Drive Bean.  It does

  1. Listening applications get a message from a queue.  There  can be multiple listening threads
  2. Get an application thread
  3. Pass it via an internal queue to the application running on another thread – the listening thread is blocked while the application is running.
  4. This application sends (puts) a message to an MQ queue for the backend server and waits for the response.
  5. Return to the listening application
  6. Free the application thread.

As this is essentially the same as a classic MDB, we had configured the number of application threads in the thread pool the same number as the listener thread pool.

Shortage of threads

The symptoms of the problem looked like a shortage of threads problem.

When we increased the number of threads in the application pool ( we gave it 4* the number of listener threads) The response time dropped – good news.  I dont know how many threads you need – is it n+1 or 2* n. I’ll leave finding the right number  as an exercise for the reader!

The hard coded 1 second wait before get

One symptom we saw was the queue depth on the replyTo queue on the server was deeper than normal.

For the reply coming back from the server, I believe there is one thread getting from the queue.

When the reply to queue is not shared

The application thread has sent the request off, and is now waiting.  This getting thread does an MQ destructive GET with wait.  When the message arrives, it looks at the content, and decides which application thread is waiting for the reply, and wakes it up.

When the reply queue is shared between instances

For example you have configured two instances for availability.  The above logic is not used.

Instance1 cannot destructively get a message because the message could be destined for instance2.  Similarly instance2 cannot get destructively get the message because it could be destined for instance1.

One way to solve this would be to do a get next browse of the message, and if it is for the instance do a get_message_under_cursor.  This works great for MQ, but not other message providers which do not have this capability.

The implementation used  is to use polling!

If there are 3 applications tasks waiting for a replies, reply1, reply3, reply4.  The logic is as follows

  1. For each reply id, use MQ message selectors to try to get reply1, reply3, reply4.   This is not a get by messageID or correlID – for which the queue manager has indexes to quickly locate the message, this is a get with message selector, which means look in every message on the queue.
  2. For any messages found – pass them to the waiting applications
  3. Do an MQGET with a message selector which does not exist – with a wait time of receiveTimeout (defaults to 1 second).  Every message is scanned looking for the message selector string, and it is not found.

Looking at a time line – in seconds and tenths of seconds
0.1 send request1, wait for reply
0.2 getting task does MQGET  wait for 1 second with non exising selector
0.2 send request 2, wait for reply
0.3 reply1 comes back
0.4 send request3, wait for reply
0.5 reply2 comes back
0.6 reply3 comes back
nothing happens
1.2 getting task waiting for 1 second times out
1.2 getting tasks gets reply1 and posts task1
1.2 getting tasks gets reply2 and posts task2
1.3 getting tasks gets reply3 and posts task3

So although  reply1 was back within 0.2 seconds (0.3 – 0.1) it was not got until time 1.2.  The message had been waiting on the queue for 0.9 seconds.

  • Total wait time for reply1 was  1.1 seconds.
  • Total wait time for reply2 was  1.2 – 0.2 = 1.0 seconds
  • Total wait time for reply3  was 1.3 – 0.4 = 0.9 seconds

Wow – what a response time killer!

You can tune this time by specifying receiveTimeout.  If you make it smaller, the wait time will be shorter, so messages will be processed faster, but the CPU cost will go up as more empty gets are being done.

This solution does not scale.

You have had a slow down, and there are now 1000 messages on this queue. (990 of these are unprocessed messages, due to timeout .  There is no task waiting for them – they never get processed – nor do they expire!)

  • MQGET for reply1.  This scans all 1000 messages – looking in each message for the message with the matching selector.  This takes 0.2 seconds.
  • MQGET for reply2. This scans all 1000 messages – looking in each message for the message with the matching selector.  This takes 0.2 seconds.
  • You have 10 threads waiting for messages, so each message has to wait for typically 10 * 0.2 seconds = 2 seconds a message!


What can you do about it.

See the Camel documentation Request-Reply over JMS, parameters, Exclusive, concurrentConsumers, and Request-Reply over JMS Using an Exclusive Fixed Reply Queue 

  1. Avoid sharing the queue.  Give each instance its own queue.  Set the Exclusive flag
  2. Tune the ReceiveTime out – making it a shorter time interval can increase the CPU as you are doing more empty gets.  You might want to set it, to a value which is 95% percentile time between the send to the server, and the reply comes back.  So if the average time is 40 ms, set it to 60 ms or 80 ms.
  3. If you are going to share the queue, make sure you clean out old messages from the queue – for example use expiry, or have a process which periodically scans the queue and moves messages older than 1 minute.
  4. Did I mention avoid sharing the queue.
  5. If you get into a vicious spiral where the response time gets longer and longer, and the reply queue from the server gets deeper – be brave and purge server reply queue.
  6. Avoid sharing the queue.


What are the JMS connection factories on webLogic doing?

As part of my long running activity to find out what is causing 1 million MQCONNects a day from an Oracle  webLogic web server, I have found out how to monitor what is going on inside the webLogic instance.

Most web servers support a Java Management eXtension (JMX) interface.  You can use gui tools like jconsole to do an ad-hoc display of the management beans – but these are   not practical for long term monitoring.

Ive listed the data from the JMX query, what the data means, and also documented how I got the data.

There are three components to an MDB

  1. A listening task waits to be notified about messages arriving on the queue.   As far as I can tell there is one thread doing this work.  If you need more I think you need to create a second MDB.
  2. Multiple MDB threads which get woken up by the listener task, get a message and invoke the MDB application OnMessage() method with the message.  The data for this part has Type=EJBPoolRuntime.
  3. The application part which processes the message – typically it connects to MQ and puts a reply, and disconnects.  This application specified which connection pool to be used using ConnectionFactory cf = (ConnectionFactory)ctx.lookup(“CF3”);  The data for this part has Type=ConnectorConnectionPoolRuntime. 


The multiple MDB threads.

This data came from the JMX record with com.bea:ServerRuntime=AdminServer2,MessageDrivenEJBRuntime=WMQ_IVT_MDB,Name=WMQ_IVT_MDB,ApplicationRuntime=MDB3,Type=EJBPoolRuntime,EJBComponentRuntime=MDB3

Where

  1.  ServerRuntime=AdminServer2. This is where the application runs
  2. MessageDrivenEJBRuntime=WMQ_IVT_MDB comes from  display-name WMQ_IVT_MDB in the ejb-jar.xml file.,Name=WMQ_IVT_MDB,
  3. ApplicationRuntime=MDB3, This is the name of the deployed .jar file.
  4. Type=EJBPoolRuntime, this is the type for the MDB threads
  5. EJBComponentRuntime=MDB3, this is the name of the deployed .jar file.

From experiementing with MDBs and adjusting parameters my picture of how the EJB thread pool works is as follows

  1. There is a general free pool for threads.
  2. There is a pool for the EJB.
  3. When a message arrives the listener thread gets a thread from the EJB pool, and executes the OnMessage() method on the thread.
  4. If there are not available threads,
    1. it waits for a free thread.
    2. if, over a period of seconds, most of the requests have had to wait for a thread, then start a new thread
      1. it gets a thread from the general pool, if none available it creates a new thread.
      2. it executes the MDB application ejbCreate() method on the thread just obtained.
      3. It executes the OnMessage() method on the thread.
      4. Puts the thread into the EJB pool as a free thread.
    3. In the ejbCreate() method, I had it write to the job log.  I could see threads started, after
  5. Periodically the EJB pool is cleaned up,  for threads which have been idle for a specific time interval
    1. execute ejbRemove() on the thread
    2. return the thread to the general free pool
  6. Periodically the general pool is cleaned up
    1. Threads which have not been used for a while are disconnected from the queue manager, and deleted.

The data came from the JMX with the defintion

com.bea:ServerRuntime=AdminServer2, Name=WMQ_IVT_MDB, ApplicationRuntime=MDB3, Type=MessageDrivenEJBRuntime, EJBComponentRuntime=MDB3


See here for the documentation.

  • AccessTotalCount = 28180,   There were this many messages processed, and  so this many OnMessage() methods executed
  • BeansInUseCount  = 2.  Deprecated
  • BeansInUseCurrentCount  = 1  One thread is currently active.
  • DestroyedTotalCount   = 0.   
  • IdleBeansCount  = 4 There are 4 free thread available in the EJB pool
  • MissTotalCount  = 19.  For 19 (out of the 28180) requests, they failed to get a free thread, and so a new thread was obtained.
  • Name  = WMQ_IVT_MDB
  • PooledBeansCurrentCount  = 3.   The numer of free threads inthe pool.
  • TimeoutTotalCount  = 0.  Number of requests timed out waiting for a thread from the free pool.
  • Type  = EJBPoolRuntime.   You can use Type=EJBPoolRuntime in the JMX query string.
  • WaiterCurrentCount  = 0. The number of requests waiting for a thread in the pool.   This value should always be zero.
  • WaiterTotalCount = 0. The total number of threads that have had to wait in the pool.  This value should always be zero, if it is non zero you need to tune your connection pool.

The data for the connection factory.

See here for some documentation.

  • ActiveConnectionsCurrentCount (Inte
  • ger) = 9.  How many connections were in use when the JMX request was issued.
  • ActiveConnectionsHighCount (Integer) = 10. The highest number of connections in use since the connection pool was started or reset
  • AverageActiveUsage (Integer) = 0. This value is always zero.
  • CapacityIncrement (Integer) = 1.   This is the value the connection pool is configured with
  • CloseCount (Long) = 5682.    How many connection.close() requests have been issued.   This will be less than or equal to ConnectionsMatchedTotalCount below.
  • ConnectionFactoryClassName (String) = com.ibm.mq.connector.outbound.ConnectionFactoryImpl.   This is the name of the connection class being used
  • ConnectionFactoryName (Null).  I could not find where to change this, or if it has any value
  • ConnectionIdleProfileCount (Integer) = 0.   This was always zero.
  • ConnectionIdleProfiles (Null).   This was always zero.
  • ConnectionLeakProfileCount (Integer) = 0.   This was always zero.  I believe this is to do with connections not being returned to a pool, perhaps connection.close() was not issued.
  • ConnectionLeakProfiles (Null).  This was always zero. I believe this is to do with connections not being returned to a pool, perhaps connection.close() was not issued.
  • ConnectionProfilingEnabled (Boolean) = false.   I could not see how to change this, or what value it adds
  • Connections (ObjectName[]) = [Ljavax.management.ObjectName;@299a06ac]  This will be an internal object within Java.
  • ConnectionsCreatedTotalCount (Integer) = 21. This is the count of instances started.   You could get connection started, connection freed, connection started, connection freed.   This would could  2 connections started.
  • ConnectionsDestroyedByErrorTotalCount (Integer) = 0.
  • ConnectionsDestroyedByShrinkingTotalCount (Integer) = 11.  After a time period, idle-timeout-seconds in weblogic-ejb-jar.xml, connections that have not processed messages for this time period are released back to the general pool.
  • ConnectionsDestroyedTotalCount (Integer) = 11.  This seems to be the same as the previous item
  • ConnectionsMatchedTotalCount (Integer) = 5670.    This many requests for a connection with matching userid etc were got from the pool
  •  ConnectionsRejectedTotalCount (Integer) = 0.  I dont know what this is
  • ConnectorEisType (String) = Java Message Service
  • CurrentCapacity (Long) = 10.   This is the size of the pool
  • EISResourceId (String) = type=<eis>, application=colin, module=colin, eis=Java
  • Message Service, destinationId=CF2
  • FreeConnectionsCurrentCount (Integer) = 1.   There is currently one free connection in the pool
  • FreeConnectionsHighCount (Integer) = 10.  This is the highest number of free connections in the pool – when there was no requests for the connection pool.
  • FreePoolSizeHighWaterMark (Long) = 10.  I dont know the difference between this and the previous item.
  • FreePoolSizeLowWaterMark (Long) = 0.   This is the lowest number of free connections – it is the gap between in use and the maximum pool size.
  • HealthState (Null).    I do not think connection pools for MDBs support this
  • HighestNumWaiters (Long) = 0.   This value was always zero.  Even when I reduced the size of the connection pool, and specified 50 threads could wait, this value was still 0
  • InitialCapacity (Integer) = 1.   This is the specified value.   This is used  to set a lower limit of connections in the pool.  Setting the initial capacity to 5 means there will always be at least 5 connections in the pool, and the pool will not be shrunk below this value
  • JNDIName (String) = CF2.  This is what is specified in the connection pool definition.   This label is used in the application ConnectionFactory cf = (ConnectionFactory)ctx.lookup(“CF2”);
  • Key (String) = CF2.  This seems to the be same as the JNDI name.
  • LastShrinkTime (Long) = 1565334529469.  This is the number of milliseconds POSIX time (since Jan 1st 1970).  To format it use  time_t now = t/1000; strftime(buff, 20, “%H:%M:%S”, localtime(&now));
  • LogFileName (Null).  You can specify logging for this adapter.  Deployments -> resource adapter -> configuration -> Outbound Connection Pools, javax.jsm.ConnectionFactory, select the connection pool,  Logging tab.  When this was active I got nothing logged in it.
  • LogFileStreamOpened (Boolean) = false
  • LoggingEnabled (Boolean) = true
  • LogRuntime (Null)
  • ManagedConnectionFactoryClassName (String) = com.ibm.mq.connector.outbound.ManagedConnectionFactoryImpl.  This is the name of the resouce adapter class.
  • MaxCapacity (Integer) = 20.   This is the maximum size of the pool.
  • MaxIdleTime (Integer) = 0.   This was always zero for me.
  • MCFClassName (String) = com.ibm.mq.connector.outbound.ManagedConnectionFactoryImpl.   This is the ManagedConnectionFactoryClassName. Same as above.
  • Name (String) = CF2.  Another connection pool identifier
  • NumberDetectedIdle (Integer) = 0.   This was always zero.
  • NumberDetectedLeaks (Integer) = 0.  This was always zero. I believe this is to do with connections not being returned to a pool, perhaps connection.close() was not issued.
  • NumUnavailableCurrentCount (Integer) = 9.   This feels like the number threads waiting while the connection pool creates a connection in the connection pool.
  • NumUnavailableHighCount (Integer) = 10.   This feels like the number threads waiting while the connection pool creates a connection in the connection pool.
  • NumWaiters (Long) = 0.   This was always zero – even through I restricited the number of connections in the pool.  I got a java exception, unable to get a connection, rather than have the thread wait.
  • NumWaitersCurrentCount (Integer) = 0.  See above.
  • Parent (ObjectName) = com.bea:ServerRuntime=AdminServer2,Name=colin, ApplicationRuntime=colin, Type=ConnectorComponentRuntime
  • PoolName (String) = CF2.   Yet another field with the name of the connection pool/
  • PoolSizeHighWaterMark (Long) = 10.   This is the highest number of connections used in the pool
  • PoolSizeLowWaterMark (Long) = 0.       This is the lowest number of connecitons used in pool
  • ProxyOn (Boolean) = false.    I could not find what this means
  • RecycledTotal (Integer) = 0.    This was always zero for me.
  • ResourceAdapterLinkRefName (Null).   You can specify this field name in your MDB definition.
  • RuntimeTransactionSupport (String) = NoTransaction.  This defines if your connections are part of a unit of work or not. NoTransaction means out of syncpoint.    You may want to specify. XATransaction.
  • ShrinkCountDownTime (Integer) = 340.  This is how long before a scan of the pool to remove any threads in the pool which have done no work for the specified interval.
  • ShrinkingEnabled (Boolean) = true
  • ShrinkPeriodMinutes (Integer) = 15.  You can specify the interval on the resource adapter definition  (Note: you specify it in seconds – it gets reported in minutes)
  • State (String) = Running.    This connection pool is started.
  • Testable (Boolean) = false.   You can defined some resources as “testable”
  • TransactionSupport (String) = NoTransaction.   This is the same as RuntimeTransactionSupport above.
  • Type (String) = ConnectorConnectionPoolRuntime.   This defines the object.   You can use the Type=ConnectorConnectionPoolRuntime  in the JMX query.

From this I can see there is a pool called CF2 which has maximum of 10 connections.  The maximum connections used was 10, the lowest was 0.

There were Connections Matched Total Count  = 5670 requests for a connection from the pool.

The pool has shrunk more than once as it has Connections Destroyed By Shrinking Total Count  = 11 connections.

Using this data, you can now plot usage over time and see if you need to increase ( or decrease) the size of the pool, or the parameters to tune when the pool is shrunk.

I do not know enough about JMX to tell if the “high” and “low” value are reset on each query, or if you can use JMX to reset them periodically. These high and low value may have little value, if they are since the webLogic instance started (6 months ago).

The data fields are mentioned here.

How I got the data

There is a python package called JMXQuery which has a .jar file which allows you to query information in a JMX server.  The output is in json format so you can use your favourite tools (python) to quickly convert this to other format, such as .csv .

The command I used was

java  -jar “/usr/local/lib/python3.6/dist-packages/jmxquery/JMXQuery-0.1.8.jar” -url service:jmx:rmi:///jndi/rmi://127.0.0.1:8091/jmxrmi -json -u webLogic
-p passw0rd -q “com.bea:ServerRuntime=AdminServer2,Name=CF2,ApplicationRuntime=colin, Type=ConnectorConnectionPoolRuntime,ConnectorComponentRuntime=colin”

which breaks down as follows

  • java – invoke java
  • -jar “/usr/local/lib/python3.6/dist-packages/jmxquery/JMXQuery-0.1.8.jar” – this jar file
  • -url service:jmx:rmi:///jndi/rmi://127.0.0.1:8091/jmxrmi – this is the url of my webLogic server
  • -json – output it in json format
  • -u webLogic -p passw0rd -q  – userid and password
  • “com.bea:ServerRuntime=AdminServer2,Name=CF2,ApplicationRuntime=colin, Type=ConnectorConnectionPoolRuntime,ConnectorComponentRuntime=colin”
    • com.bea is the bean type
    • The admin server was called AdminServer2
    • The connection factory was CF2
    • The resource adapter is installed under “Deployments”  as colin
    • Type=ConnectorConnectionPoolRuntime is the type of bean

I then used |jq . |grep -v mBean > bb to convert the one line json to one field per line, dropped the mBean value, and put it to a file.  The output was like

[
 {
   "attribute": "Connections",
   "attributeType": "ObjectName[]",
   "value": "[Ljavax.management.ObjectName;@299a06ac"
 },
 {
   "attribute": "FreeConnectionsCurrentCount",
   "attributeType": "Integer",
   "value": 4
},
etc

You can put generics in for example

java  -jar “/usr/local/lib/python3.6/dist-packages/jmxquery/JMXQuery-0.1.8.jar” -url service:jmx:rmi:///jndi/rmi://127.0.0.1:8091/jmxrmi -json -u readonly -p read0nly -q “com.bea:ApplicationRuntime=*,ConnectorComponentRuntime=*,Name=”CP*”,ServerRuntime=*,Type=ConnectorConnectionPoolRuntime” e=*,Type=ConnectorConnectionPoolRuntime” > aa


Where this uses a userid set up as a monitor id, “*” has been specified for many values, and only give objects beginning with “CP”.  Note blanks have meaning. “,,,=*, Name=…” looks for an object with blank,N,a,m,e,

Data when not using a resource adapter

The above information was for a resource adapter.  When an EJB 2 MDB is deployed (non resource adapter)

from –q  “com.bea:ApplicationRuntime=MDB3,EJBComponentRuntime=MDB3,
MessageDrivenEJBRuntime=WMQ_IVT_MDB_JMSQ1,
Name=WMQ_IVT_MDB_JMSQ1,ServerRuntime=AdminServer2,Type=EJBPoolRuntime”

Where the weblogic-jar-xml has

<weblogic-ejb-jar> <ejb-name>WMQ_IVT_MDB</ejb-name>
<destination-jndi-name>JMSQ1</destination-jndi-name>

The data was

BeansInUseCount (Integer) = 0
PooledBeansCurrentCount (Integer) = 10
IdleBeansCount (Integer) = 10
BeansInUseCurrentCount (Integer) = 0
DestroyedTotalCount (Long) = 0
WaiterCurrentCount (Integer) = 0
Name (String) = WMQ_IVT_MDB_JMSQ1
MissTotalCount (Long) = 7
AccessTotalCount (Long) = 28
Type (String) = EJBPoolRuntime
TimeoutTotalCount (Long) = 0
WaiterTotalCount (Long) = 0

With

-q “com.bea:ApplicationRuntime=MDB3,EJBComponentRuntime=MDB3, MessageDrivenEJBRuntime=WMQ_IVT_MDB_JMSQ1,Name=WMQ_IVT_MDB_JMSQ1,
ServerRuntime=AdminServer2,Type=EJBTransactionRuntime

the output was

TransactionsRolledBackTotalCount (Long) = 0
TransactionsTimedOutTotalCount (Long) = 0
Name (String) = WMQ_IVT_MDB_JMSQ1
Type (String) = EJBTransactionRuntime
TransactionsCommittedTotalCount (Long) = 0

What shape is your application splat?

There are a limited set of architectural patterns for MQ. I was working with Niels Simanis on how to identify them, and how to see if they change over time. Niels suggested the application splat gave a good visualization. The data behind it could be used by machine learning to tell if the pattern changes.

What are some typical application patterns?

1. Classic front end application MQCONN.. MQPUT, MQGET, .. MQDISC
2. Classic front end application with optimised application, MQCONN, n * ( MQPUT, MQGET ).. MQDISC
3. Classic back end MQCONN n * ( MQGET, MQPUT to different queues), MQDISC
4. Sender channel, MQGET, SEND, MQGET, SEND, MQGET SEND , ( Puts and gets to SYSTEM.CHANNEL.SYCNQ)
5. Receiver channel, RECEIVE, MQPUT, RECEIVE MQPUT, ( Puts and gets to SYSTEM.CHANNEL.SYCNQ)
6. Trigger monitor MQCONN N * (MQGET with BROWSE)

Within this we can have persistent message, non persistent messages; big message and small messages.

Some poor patterns which waste resources.

1. Do no work, MQCONN, MQDISC
2. The polling application ,MQPUT, n * (MQGET wait for 10 milliseconds)
3. The careless application for every MQGET , return code buffer too small, allocate bigger buffer, MQGET

What is a splat?

From the MQ accounting data , or the application trace (on Midrange) you can extract the statistics on the various MQ verbs
1. MQCONN
2. MQPUT of persistent messages
3. MQPUT of non persistent messages
4. MQPUT1 of persistent messages
5. MQPUT1 of non persistent messages
6. Successful MQGETS of persistent messages
7. Successul MQGETS of non persisttent messages
8. Successful MQGET with browse
9. Number of gets with non zero return code
10. Number of queues used for putting. For example putting to a clustered queue
11. Number of queues used for getting
12. Big puts > n KB
13. Small puts <= n KB
14. Big gets > n KB
15. Small gets <= n KB
16. MQCTL
17. MQCB
18. MQCMIT
19. MQBACK
20. MQPUB
21. MQSUB

MQOPEN, MQCLOSE, MQINQ and MQSET could be added to the list to make it more complete.

You can take this data and create a radar or splat chart.

Splat

The graph looks like a paint ball has been splattered against a wall, or for the more refined, dropping a glass of red wine on a white carpet.

The data is normalized by dividing all the numbers by the sum of successful puts and gets (or 1 if there are no successful puts or gets).

What does this show us ?

We can make several observations from this chart

  1. It looks like there is a connect for every MQPUT – this gives scope for optimization
  2. Using MQPUT1 may be better than MQOPEN, MQPUT, MQCLOSE
  3. There is a high number of get errors.  In this case every message had RC 2080 – buffer too small.
  4. There were puts to multiple queues.   This was a clustered queue with two backends
  5. The size of the put message was > 4000 bytes.  The returned messages a mixture of sizes.  Some were > 4000 bytes, the remainder were below 4000 bytes.

With this splat graph it is easy to see if the applications are similar. For example
1. Are two business applications similar?
2. Has the shape of an application changed over time , either due to “improvements” or the workload changing.
3. You can have a “best practices profile” and see how different an application is from your the best practice profile.


Effects of application tuning

Splat2

The application was tuned to use non persistent messages (as persistence was not needed) and do more work within MQCONN… MQDISC – leading to a reduction in MQCONNs.

Are my digital certificates still valid and are they slowing down my channel start?

Digital certificates are great. They allow program to program communication so each end can get information to identify the other end, and the programs can then communicate securely, with encryption, or just checking the payload has not changed.

A certificate is basically a file with two parts (or two files)  – a public certificate and a private key. You can publicize the public part to any one who wants it (which is why is is called the public part). Anyone with the private key can use it to say they are you. (If you can get access to the private key, then you can impersonate the identity)

There are times when you want to say this certificate is not longer valid. For example when I worked at IBM, I had a certificate on my laptop to access the IBM mail servers.

  • If my laptop was stolen, IBM would need to revoke the certificate.
  • When I retired from IBM, IBM revoked my certificate to prevent me from trying to access my IBM mail using my old certificate from my personal laptop.

Managing these certificate is difficult. There could be billions of certificates in use today.

Your server should validate every connection request to ensure the certificate sent from the client is still valid.

A client should validate the certificate sent by the server to ensure that it is connecting to a valid server.

In the early days of certificates, there was a big list of revoked certificates – the Certificate Revocation List(CRL). If a certificate is on the list then it has been revoked. You tend to have an LDAP server within your firewall which contains these lists of revoked certificates.

This was a step in the right direction, but it is difficult to keep these lists up to date, when you consider how many certificates are in use today, and how many organizations generate certificates. How often do I need to refresh my list? If the CRL server was to refresh it every day, it may be up to one day out of date, and report “this certificate is ok” – when it had been revoked.

These days there is a technique called Online Certificate Status Protocol (OCSP). Basically this says go and ask the site which issued this certificate if it is still valid. This is a good idea – and they say the simple ideas are the best.
How do you know who to ask? A certificate can have url information within in it Authority Information Access: OCSP – URI:http://ColinsCert.Checker.com/, or you can specify URL information in the queue manager configuration for those certificates without the Authority Information Access(AIA) information.

Often the URL in the certificate is outside of your organization, and outside of your firewall. To access the OCSP site you may need to have an SSL Proxy server which has access through the firewall.

You can configure MQ to use a (one) OCSP server for those certificates not using AIA information.  If your organization is a multinational company, you may be working with other companies who use different Certificate Authorities.   If you have certificates from more than one CA, you will not be able use MQ to check all of them to see if they are still valid.  You may want to set up an offline job which runs periodically and checks the validity of the certificates.

Starting the MQ channel can be slow

When an TLS/SSL MQ channel is started, you can use OCSP or CRL to check that a certificate is valid. This means sending a request to a remote server and waiting for a response.   The LDAP server for CRL requests is likely to be within your domain,  as your organization manages it. The OCSP  server could be outside of your control, and in the external network.  If this server is slow, or the access to the server is slow, the channel will be slow to start.  For many customers the network time within a site is under 1 millisecond, between two sites could be 50 ms. Going to an external site the time could be seconds – and dependent on the traffic to the external site.
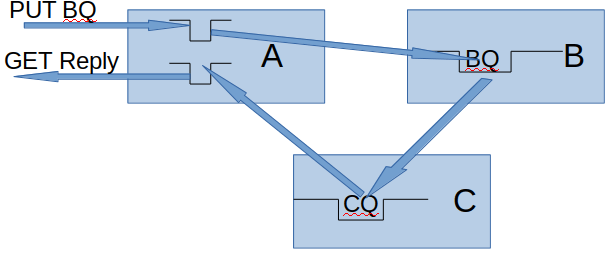
This time may be acceptable when starting the channel, first thing in the morning, but restarting a channel during a busy period can cause a spike in traffic because no messages flow while the channel is starting. For example

ChannelwithRestart

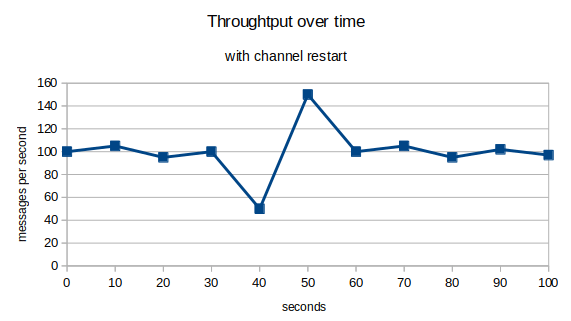
No messages will flow while the channel is starting, and this delay will add to the round trip time of the messages.

How do I check to see if I have a problem

This is tough. MQ does not provide any information. I used MQ internal trace when debugging problems, but you cannot run with trace enabled during normal running.

There are two parts to the validation request. The time to get to and from the server, and the time to process your request once it has got to the server.

You can use TCP Ping to get to the server (or to the proxy server).  If you are using a proxy server you cannot “ping” through the proxy server.

Openssl provides a many functions for creating and managing certificates.

You can use the command

time openssl s_client -connect server:port
or
time openssl s_client -connect -proxy host:port server:port

The “time” is a linux command which tells your the duration in milliseconds of the command following it.

The openssl s_client is a powerful ssl client program. The -connect… tries connecting to server:port. You can specify -proxy host:port to use the proxy.

The server at the remote end may not recognize the request – but you will get the response time of the request.

Running this on my laptop I got

time openssl s_client -connect 127.0.0.1:8888
CONNECTED(00000005)
140566846001600:error:1408F10B:SSL routines:ssl3_get_record:wrong version number:../ssl/record/ssl3_record.c:332:

no peer certificate available

No client certificate CA names sent

SSL handshake has read 5 bytes and written 233 bytes

Verification: OK

real 0m0.012s

The request took 0.012 seconds.

My openssl OCSP server reported

OCSP Response Data:
OCSP Response Status: malformedrequest (0x1)

You can use openssl ocsp …. to send a certificate validation request to the OCSP server and check the validity of the system – but you would have to first extract the certificates from the iKeyman keystore.

How do I test this?

I’ve created the instructions I used:

More information about OCSP.

There is a good article in the IBM Knowledge Centre here .

The article says
To check the revocation status of a digital certificate using OCSP, IBM MQ determines which OCSP responder to contact in one of two ways:

  1. Using a URL specified in an authentication information object or specified by a client application.
  2. Using the AuthorityInfoAccess (AIA) certificate extension in the certificate to be checked.

Configure a QM for OSCP checking for certificates without AIA information.

You can configure a queue manager to do OCSP checking, for those certificates without AIA information within the certificate.

There is a queue manager attribute SSLCRLNL ( SSL Certificate RevocationList Name List) which points to a name list.   This name list has a list of AUTHINFO object names.
The name list can have up to one AUTHINFO object for OCSP checking and up to 10 AUTHINFO objects for CRL checking.

You define an AUTHINFO object to define the URL of an OCSP server.

Define AUTHINFO(MYOSCP) AUTHTYPE(OCSP) OCSPURL(‘HTTP://MyOSCP.server’)

Create a name list, and add the AUTHINFO to it.

Use alter qmgr  SSLCRLNL(name) and refresh security type(SSL)
You need to change the qm.ini file SSL stanza of the queue manager configuration file see here.

OCSPAuthentication=REQUIRED|WARN|OPTIONAL
OCSPCheckExtensions= YES|NO
SSLHTTPProxyName= string

If you have a fire wall around your network, you can use SSLHTTPProxyName to get through your fire wall.

There is some good information here.

Configure client OSCP checking for certificates without AIA information.

You need the CCDT created by a queue manager rather than a JSON CCDT.
When you configure a queue manager with the AUTHINFO objects and the queue manager SSLCRLNL attributes, the information is copied to the CCDT.

This CCDT is in the usual location, for example the /prefix/qmgrs/QUEUEMANAGERNAME/@ipcc directory.

You can use a CCDT from one queue manager, when accessing other queue managers.

You need to make the CCDT file available to the client machines, for example email or FTP,  or use URL access to the CCDT.

You also should configure the mqclient.ini file see here.

How do I check to see if my certificates have AIA information.

You can use the iKeyman GUI to display details about the certificate, or a command line like

/opt/mqm/bin/runmqckm -cert -details -db key.kdb -pw password -label CLIENT

This gives output like

Label: CLIENT
Key Size: 2048
Version: X509 V3
Serial Number: 01
Issued by: ….

Extensions:
– AuthorityInfoAccess: ObjectId: 1.3.6.1.5.5.7.1.1 Criticality=false
AuthorityInfoAccess [
[accessMethod: ocsp
accessLocation: URIName: http://ocsp
server.my.host/
]
]

Can I turn this OCSP checking off ?

For example if you think you have a problem with OCSP server response time.

In the mqclient.ini you can set

  • ClientRevocationChecks = DISABLED No attempt is made to load certificate revocation configuration from the CCDT and no certificate revocation checking is done
  • OCSPCheckExtensions = NO   This says ignore the URL in the AIA information within a certificate.

See SSL stanza of the client configuration file.

In the qm.ini you can set

  • OCSPCheckExtensions=NO  This says ignore the URL in the AIA information within a certificate.
  • alter qmgr SSLCRLNL(‘ ‘) and refresh security type(SSL)

See SSL stanza of the queue manager configuration file and Revoked certificates and OCSP.

How do I tell if I have a problem with OCSP?

There are no events or messages which tell you the response time of requests.

You may get message AMQ9716

AMQ9716
Remote SSL certificate revocation status check failed for channel …
Explanation
IBM MQ failed to determine the revocation status of the remote SSL certificate for one of the following reasons:
(a) The channel was unable to contact any of the CRL servers or OCSP responders for the certificate.
(b) None of the OCSP responders contacted knows the revocation status of the certificate.
(c) An OCSP response was received, but the digital signature of the response could not be verified.
You can change the queue manager configuration to not produce these messages, by setting ClientRevocationChecks = OPTIONAL
From this message you cannot tell if the request got to the server.
The easiest way may be to ask the network people to take a packet trace to the URL(s) and review the time of the requests and the responses.

Using the AuthorityInfoAccess (AIA) certificate extension in the certificate.

You can create certificates containing the URL needed to validate the certificate. Most of the IBM MQ documentation assumes you have already have a certificate with this information in it.
You can use openssl to create a certificate with AIA information, and import it into the iKeyman keystore.   See here.

You cannot use IBM GSKIT program iKeyman to generate this data because it does not support it. You can use iKeyman to display the information once it is inside the keystore.

Timing the validation request

Openssl has a command to validate a certificate for example

openssl ocsp -CAfile cacert.pem -issuer cacert.pem -cert servercert.pem -url http://OCSP.server.com:port -resp_text

You can use the linux time command, for example

time openssl ocsp -CAfile cacert.pem -issuer cacert.pem -cert servercert.pem -url http://OCSP.server.com:port -resp_text

you get

Response verify OK
servercert.pem: good
real 0m0.040s

The time taken to go to a OCSP server on the same machine is 40 milliseconds. The time for a ping to 127.0.0.1 was also 40 ms.

Thanks…

Thanks to Morag of MQGEM, and Gwydion at IBM for helping me get my head round this topic.

Whoops my QM emergency recovery procedures did not recover QM in an emergency!

I was working with someone, and we managed to kill a test queue manager on midrange.  I suggested we test out the “emergency procedures” as if this was production and see if we could get “production” back in 30 minutes.

We learned so much from this exercise, so we are now working on a new emergency recovery procedure.

What killed the queue manager

The whole experience started when we thought had better clean up some of the MQ recovery logs.   With circular logging the when the last log fills up it overwrites the first one.  This is fine for many people but it means you may not be able to recover a queue if it is damaged.
We had linear logging, where the logs are not overwritten, MQ just keeps creating new logs.   You can recover queues if they are damaged, because you can go back through the logs.
As our disk was filling up someone deleted some old logs – which were over a week old – and were “obviously” not needed.

MQ was shut down, and restarted – and failed to start.

Lesson 1:  With linear logging you are meant to use the rcdmqimg command which copies queue contents to the log.   You get a message telling you which logs are needed for object recovery, and which logs are needed for restart.   This information is also in the  AMQERRxx.LOG.  You cannot just delete old logs as they may still be needed.

Issue the command at least daily.

Lesson 2:  HA disks do not give you HA.   The disks were mirrored to the backup site – also to the DR site.  The delete file command was reliably done on all disk copies.  We could not start MQ on any site because of the missing file.  We should have had a second queue manager.

These HA disk solutions and active/standby give you faster access to your data, in  a multi site environment, they do not give you High Availability

Initial panic – what options do we have

Lesson 3: Your instructions on how to recover from critical situations need to be readily available.  They should be tested regularly.    We could not find any. You need a process to follow which works, and you have timings for.  So you do not have a half hour discussion “should we restore from backup?”, “how long will it take?”, “will it work?”, “how do we restore from backup”.   The optimum solution may be to shoot  the queue manager and recreate it.  This may be the optimum route to getting MQ “production” back.  You should not have to make critical decisions under pressure, the decision path should have been documented when you have the luxury of time.

Lesson 4: you need to capture the output of every command you are doing.  Support teams will ask “please send me the error logs”.  You do not want to have to copy an paste all of your terminal data.  Linux has a “script” command which does this.  They could not email me the log showing the problems, so we had to have a conference call, and “share screens” to see what was going on, which made it hard for me to look at the problem “up a bit, down a bit – too far”.  All of which extended the recovery period.

Lesson 5: “Let’s restore from the backups”  These backups were taken  12 hours before and were not current, and we did not know how to restore them.
(Little thought, should backups be taken when a QM is down, or do you get integrity issues because files and logs were backed up at different times? – I know z/OS can handle this – Feedback from Matt at IBM.  Yes the queue manager should be shut down for backups – so you need two or three queue managers in your environment.

Make sure you backup your SSL keystore.

Let’s recreate the queue manager

Lesson  6: Do you have any special actions to delete multi instance queue managers.

Do you need linux people to do anything with the shared disks?

Lesson 7: Save key queue manager configuration files.  When you delete a queue manager instance – it deletes any qm.in and MQAT.ini files – you need them as they may have additional customising, for example SSL information.
Of course you are backing these files up -and of course you (personally)  have tested that you can  recover them from the backup.

Copy qm.in and MQAT.ini to a safe location before you delete the queue manager.

Lesson 8:  Ensure people have enough authority to be able to do all the tasks – or have an emergency “break glass userid”.  Many sites only allow operations people to access production with change capability.

Lesson 9:  You need to know how the  create queue manager command and parameters used to create the queue manager.
Some queue manager options can be changed after the queue manager has been started.  Others cannot – for example linear logging|circular logging.  Size of log files etc.

You need to have saved the original command used with all of the options.   Do not forget that when you did it the first time it was MQ V7.5 – you are now migrated to MQ V9, so it should work OK!

Lesson 10: Copy the qm.ini files etc and overwrite the newly created ones.

Start the queue manager.

Lesson 11:  Customize the queue manager.  You need to have a file of all of your objects queues and channels etc.  You may have a file which you use to create all new queue managers, but this may not  be up to date.  It is better to run dmpmqcfg every day to dump the definitions to get the “current” state of the objects which you can reload.
The -o 1line option is useful as then you can use grep to select objects with all the parameters.

Lesson 12: In your emergency recreate document  note how long each stage takes.  One step, closing down the queue manager took several minutes.  We were discussing if was looping or not – and should we cancel it.  Eventually it shut down.  It would have been better to know this stage takes 5 minutes.

Lesson 13: Document the expected output from each stage – and highlight any stage which gives warnings or errors.  We ran runmqsc with a file of definitions, and it reported 7 errors.  We wasted time checking these out.  Afterward we were told “We always get those”.

Lesson 14: Do you need to do work for your multi instance queue managers?

Getting the queue manager back into “production”. 

Lesson 15: Resetting receiver channel sequence numbers.   Sender and receiver channels will have the wrong sequence number.  You can reset the sender channels yourself.  Receiver channels are a bit harder, as the “other end” has to reset the sequence number. You can  either

  • Contact the people responsible for the other end (you do have their contact details dont you?) and
  • ask them to reset the channel,

or you wait till their queue manager sends you a message – and then you get notified of the sequence number mismatch, and can use reset channel to reset your number to the expected number.   The channel will retry and this time it will  work.  This means you need to sit by your computer, waiting for these events.  Maybe no messages will be sent over the weekend, and so you can logon first thing Monday morning to catch the events.

Lesson 16: Your SSL keystore is still available isnt it?

Lesson 17: Is every one who has the on-call phone familiar with this procedure, and has practiced it?

Lesson 18: People need to be familiar with the tools on the platform.  You may normally use notepad to edit files on your personal work station.  On the production box you only have “vi”.

Overall – this is one process that needs to work – and to get your queue manager up in the optimum time.  You need to practice it, and get it right.

Summary

You need to practice emergency recovery situations

I used to do Scuba diving.  You learn, and have to practice “ditch and retrieve” where you take your kit off under water and have to put it on again.   Once I needed to do this in the sea.  It was dark, I got caught in a fishing net, so I had to take my kit off, untangle it (by touch), and put it on again.  If I had not practiced this I would not be here today.


Checking the daisy chain around my MQ network

Young children collect flowers and chain them to make a circle and so make a daisy chain.

People also talk about daisy chaining electrical extension leads together to make a very long lead out of lots of small leads.

In MQ we can also have daisy chains.  One use is to check all of the links are working, and there are no delays on the channels.

If an application puts a message onto the Clustered Request Queue(BQ) on QMA, it goes around and the reply can be got from the Reply queue, then we have checked all the links are working; we have daisy chained the requests.

DaisyChainOnce I Once I got it working the definitions were simple.


On QMB

DEFINE QR(BQ) RQMNAME(QMC) RNAME(CQ) CLUSTER(MYCLUSTER)

On QMC

DEFINE QREMOTE(CQ) CLUSTER(MYCLUSTER) RQMNAME(QMA) RNAME(REPLY)

On QMA

DEFINE QL(REPLY)

Once we have set the definitions up I could can use the MQ utility dspmqrte to show us the path.  For example

  • dspmqrte puts a message to the BQ .  This is a clustered queued on QMB,  It reports the queue BQ is being used, and stores the message on SYSTEM.CLUSTER.XMIT.QUEUE.
  • On QMA the channel TO.B gets the message from the SCTQ and sends it
  • On QMB the channel TO.B says put this to BQ, which is defined as CQ, and stores it on the SCTQ.
  • On QMB the channel TO.C gets the message from the SCTQ and sends it to QMC.
  • On QMC the channel TO.C says put this to CQ, which is defined as REPLY,  and stores if on SCTQ
  • On QMC the channel TO.A gets the message from the SCTQ and sends it to QMA.
  • On QMA the channel TO.A puts it to the Reply queue.

I used dspmqrte -m QMA -q BQ …, and it worked like magic.   I requested summary information(-v summary) and I got the following output, which shows the intermediate queues used.

AMQ8653I: DSPMQRTE command started with options ‘-m QMA -qBQ -rqCP0001 -rqm QMA -v summary -d yes -w5’.
AMQ8659I: DSPMQRTE command successfully put a message on queue ‘SYSTEM.CLUSTER.TRANSMIT.QUEUE’, queue manager ‘QMA’.
AMQ8674I: DSPMQRTE command is now waiting for information to display.
AMQ8666I: Queue ‘SYSTEM.CLUSTER.TRANSMIT.QUEUE’ on queue manager ‘QMA’.
AMQ8666I: Queue ‘SYSTEM.CLUSTER.TRANSMIT.QUEUE’ on queue manager ‘QMB’.
AMQ8666I: Queue ‘SYSTEM.CLUSTER.TRANSMIT.QUEUE’ on queue manager ‘QMC’.
AMQ8666I: Queue ‘REPLY’ on queue manager ‘QMA’.
AMQ8652I: DSPMQRTE command has finished.

Note, specifying RQMNAME is not required, and clustering will pick a queue manager which hosts the queue.  This means that you may be testing a different path to what you expected.  By using it you specify the route.

When I stopped QMC and retried the dspmqrte command , I got

AMQ8653I: DSPMQRTE command started with options ‘-m QMA -qBQ -rqCP0001 -rqm QMA -v summary -d yes -w5’.
AMQ8659I: DSPMQRTE command successfully put a message on queue ‘SYSTEM.CLUSTER.TRANSMIT.QUEUE’, queue manager ‘QMA’.
AMQ8674I: DSPMQRTE command is now waiting for information to display.
AMQ8666I: Queue ‘SYSTEM.CLUSTER.TRANSMIT.QUEUE’ on queue manager ‘QMA’.
AMQ8666I: Queue ‘SYSTEM.CLUSTER.TRANSMIT.QUEUE’ on queue manager ‘QMB’.
AMQ8652I: DSPMQRTE command has finished.

It does not report that there were any problems;  it just did not report two hops.

To see if there are problem, I think the best thing to do is pipe the output into a file

dspmqrte… > today

and compare this with a good day.

diff today goodday -d  gave me the differences – so I could see there was a problem because I was missing

> AMQ8666I: Queue ‘SYSTEM.CLUSTER.TRANSMIT.QUEUE’ on queue manager ‘QMC’.
> AMQ8666I: Queue ‘REPLY’ on queue manager ‘QMA’.


I had tried to define a clustered queue alias queues instead of a remote queue.  I got responses like

Feedback: UnknownAliasBaseQ, MQRC_UNKNOWN_ALIAS_BASE_Q, RC2082.

When is activity trace enabled?

I found the documentation for activity trace was not clear as to the activity trace settings.

In mqat.ini you can provide information as to what applications (including channels) you want traced.

For example

applicationTrace:
ApplClass=USER
ApplName=progput
Trace=OFF

This file and trace value are checked when the application connects.  If you have TRACE=ON when the application connects, and you change it to TRACE=OFF, it will continue tracing.

If you have TRACE=OFF specified, and the application connects, changing it to TRACE=ON will not produce any records.

With

  • TRACE=ON, the application will be traced
  • TRACE=OFF the application will not be traced
  • TRACE= or omitted then the tracing depends on alter qmgr ACTVTRC(ON|OFF).   For a long running transaction using alter qmgr to turn it on, and then off, you will get trace records for the application from in the gap.

If you have

applicationTrace:
ApplClass=USER 
ApplName=prog* 
Trace=OFF

applicationTrace:
ApplClass=USER 
ApplName=progp*
Trace=ON

then program progput will have trace turned on because the definition is more specific.

You could have

applicationTrace:
ApplClass=USER 
ApplName=progzzz
Trace=OFF

applicationTrace:
ApplClass=USER 
ApplName=prog*
Trace=

to  be able to turn trace on for all programs beginning with prog, but not to trace progzzz.


Thanks to Morag of MQGEM  who got in contact with me, and said  long running tasks are notified of a change to the mqat.ini file, if the file has changed, and a queue manager attributed has been changed – even if it is changed to the same variable.

This and lots of other great info about activity trace (a whole presentation’s worth of information) is available here.

Sorting out the MQ application trace knotted spaghetti.

You can turn on report = MQRO_ACTIVITY to get activity traces sent to a queue.   This shows the hops and activity of your message.
You can create your own trace route messages to be sent to a remote queue, and get back the hops to get to the queue, or you can use the dspmqrte command to do this for you.

Which ever way you do it, the result is a collection of messages in your specified reply queue.  The problem is how do you untangle the messages.  It is not easy with for a single message.  If you are getting these activity messages every 10 seconds from multiple transactions, you quickly  get knotted spaghetti!   To entangle the spaghetti even more, you could have a central site processing these data from many queue managers, so you get data from multiple messages, and multiple queue managers.

You can get a message for part of your application or transaction.  For example,

  • a message with information about the first 10 MQ verbs your program uses.
  • a message for the sender channel with the MQGET and the send for the local queue manager, and the remote queue manager will send a message with the channel’s receive and MQPUT.

The easy bit – messages for activity on your queue manager.

The event message has a header section.  This has information including

QueueManager: ‘QMA’
Host Name: ‘colinpaice’
SeqNumber: 0
ApplicationName: ‘amqsact’
ApplicationPid: 28683
UserId: ‘colinpaice’

From  QueueManager: ‘QMA‘ and Host Name: ‘colinpaice‘, you know which machine and queue manager you are on.

From ApplicationPid: 28683 SeqNumber: 0, you can see the records for this applications Process ID, and the sequence number.   This happens to be for a program ApplicationName: ‘amqsact’ and UserId: ‘colinpaice’.  I dont know when the sequence number wraps.  If the application ends, and the same process is reused,  I would expect the sequence number to be reset to 0.

You may have many threads running in a process , such as for a web server.  For each MQ operation  there is information for example

MQI Operation: 0
Operation Id: MQXF_PUT
ApplicationTid: 81
OperationDate: ‘2019-05-25′
OperationTime: ’14:28:18’
High Res Time: 1558790898843979
QMgr Operation Duration: 114

We can see that this is for Task ID 81.

So to tie up all of the activity for a program, you have to select the records with the same ApplicationPid, and check the SeqNumber to make sure you are not missing records.  Then you can locate the record with the same TID.
You also need to remember that a thread behaviour can be complex ( like adding meat balls to the spaghetti).  Because of thread pooling, an application may finish with the thread, and the thread can be reused.  If a thread is not being used, it can be deleted, so you will get MQBACK and MQDISC occurring after a period of time.

It is similar for channels

For a sending channel you get the following fields.

QueueManager: ‘QMA’
Host Name: ‘colinpaice’
SeqNumber: 1723
ApplicationName: ‘runmqchl’
Application Type: MQAT_QMGR
ApplicationPid: 5157
ConnName: ‘127.0.0.1(1416)’
Channel Type: MQCHT_CLUSSDR

MQI Operation: 0
Operation Id: MQXF_GET
ApplicationTid: 1

For a  receiving channel you get

QueueManager: ‘QMA’
Host Name: ‘colinpaice’

SeqNumber: 1746
ApplicationName: ‘amqrmppa’
ApplicationPid: 4509
UserId: ‘colinpaice’

Channel Name: ‘CL.QMA’
ConnName: ‘127.0.0.1’
Channel Type: MQCHT_CLUSRCVR

MQI Operation: 0
Operation Id: MQXF_OPEN
ApplicationTid: 5
….
MQI Operation: 1
Operation Id: MQXF_PUT
ApplicationTid: 5
….

As there can be many receiver channels with the same name for example an Receiver MCA channel, you should be able to use the CONNAME IP address to identify the channel being used.

They may have the same or different ApplicationPid.

It might be easier just search all of the channels for the messages with matching msgid and correlid!